

Moving house in Britain means a long list of phone calls, and the broadband tends to sit near the top. One provider lets customers transfer their contract to a new address online, and the engineers who connect the new place get glowing feedback. Even so, the effort score for home moves drops from 5.9 to 4.7 within a single quarter. The cause turns out to be the online form, which refuses any moving date less than 30 days away. Renters who find a new flat at a fortnight’s notice end up phoning, waiting in a queue and telling the whole story twice. The friendly engineer at the end hasn’t changed. Reaching them has become a chore.
The Customer Effort Score is a metric for measuring how much effort customers have to put in to get something sorted. Once a task is finished, such as placing an order, sending something back or getting a fault fixed, customers rate how easy it was to get their issue resolved on a scale from 1 (very difficult) to 7 (very easy). Average the ratings and you have the CES, a figure somewhere between 1.0 and 7.0. This guide takes you through collecting it, calculating it and reading it, and explains why an average is particularly good at hiding trouble with this metric.
📌 Key points at a glance
- CES rates how easy a task was, on a 1 to 7 scale.
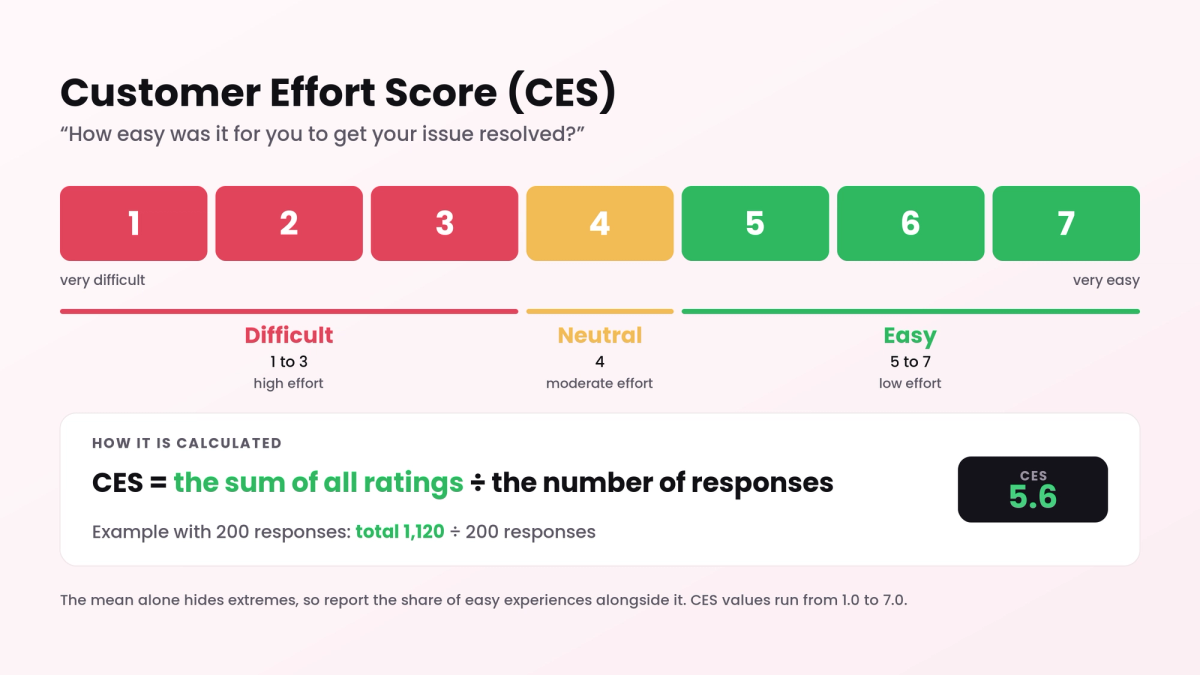
- Easy means 5 to 7, difficult means 1 to 3.
- CES = sum of all ratings ÷ number of responses.
- Possible scores: 1.0 (very difficult) up to 7.0 (very easy).
- Introduced in the Harvard Business Review in 2010.
Create a survey for free
With empirio.ai you can create a modern online survey in minutes — with hosting in the EU.
- AI-built survey
- Adjust by drag & drop
- Real-time analysis
What is the CES?
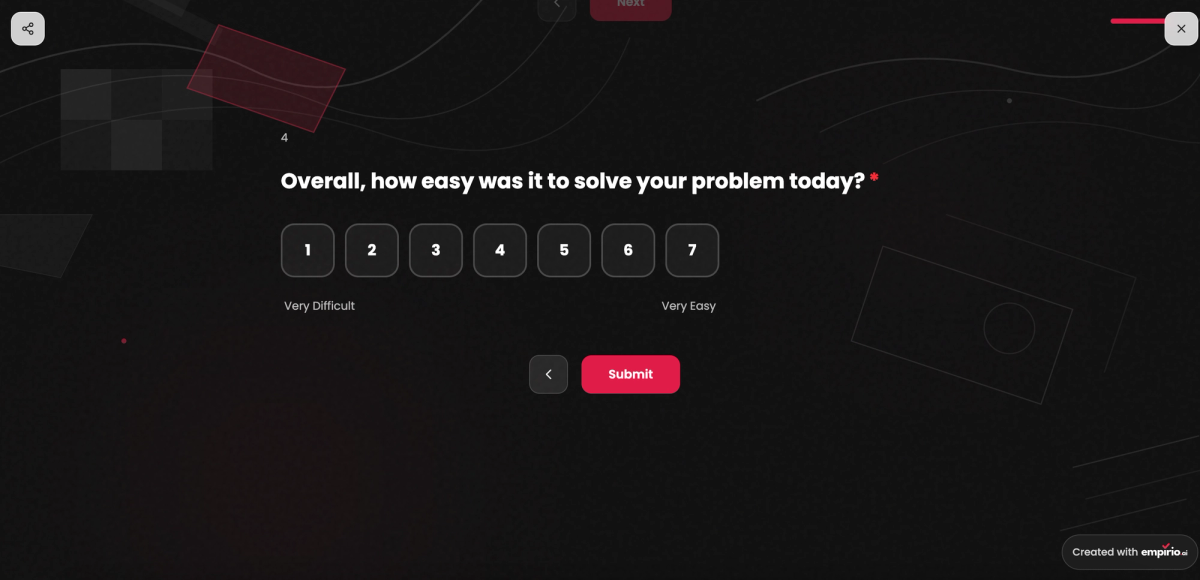
The CES, short for Customer Effort Score, measures how smoothly a customer got something done, using one question:
“How easy was it for you to get your issue resolved?”
The seven answer options stretch from 1, very difficult, to 7, very easy, so a higher CES is better.
Three researchers at the Corporate Executive Board, an advisory business Gartner has since absorbed, put the CES on the map: Matthew Dixon, Karen Freeman and Nicholas Toman. Their case for it, headlined “Stop Trying to Delight Your Customers”, ran in the Harvard Business Review for July/August 2010. Their evidence came from more than 75,000 people, surveyed over three years about contact centre calls and self-service. Delight, they argued, does less for loyalty than removing hassle. Where effort had been low, 94 per cent planned to buy again, 88 per cent to spend more and a mere 1 per cent to badmouth the company. Where effort had been high, 81 per cent planned to do just that.
The first version asked “How much effort did you personally have to put forth to handle your request?”, with answers from 1 (very low effort) to 5 (very high effort), so low was good. CES 2.0, the later revision used in our template, swaps the question for a statement rated on seven points of agreement: “The company made it easy for me to handle my issue.” In both modern versions, 7 is the good end.
The difference between “easy” and “satisfied”
Friendly and effortless are not the same thing. A charming adviser doesn’t make up for this being your third call about one problem. Satisfaction judges how you feel at the end, the CES what it took to get there, and cutting out steps often does more than extra warmth.
Difficult, neutral or easy: reading the seven points
Every rating from 1 to 7 feeds into the average. For interpretation, it helps to group them as well:
- Easy with 5 to 7: the customer got what they needed without a struggle.
- Neutral with 4: it worked, but nobody would call it smooth.
- Difficult with 1 to 3: the customer battled with forms, hold queues or being passed from one team to the next.
The NPS and the CSAT count shares of answers. The CES, in the form most companies use, takes the mean instead. The advantage is sensitivity: every point on the scale counts, so modest progress becomes visible. The drawback is that extremes cancel out. One 7 plus one 1 averages 4, exactly like two neutral answers. Put the share of easy experiences next to the average every time you report it.
Only the two ends of the scale carry labels, which makes it a rating scale in the classic sense. Watch the direction closely. With 7 meaning easy, a higher CES is better. On the 2010 original, where a high number meant high effort, it was the other way round.
Tip
What the CES cannot tell you is whether customers left happy. That is the job of the Customer Satisfaction Score. Following a service contact, put the effort question first and the satisfaction question second. Comparing the two shows whether a poor impression was caused by the result or by the journey to it.
How the CES is calculated: formula and worked example
The CES is the sum of all ratings divided by the number of respondents: an average from 1.0 to 7.0, usually given to one decimal place.
- Multiply per step. Multiply each rating by the number of people who chose it.
- Sum it up. Adding the seven products together gives the total points.
- Divide by the responses. The total over the number of respondents is your CES.
With your counts to hand, calculate your CES here and see at a glance who found it easy, neutral or difficult.
Customer Effort Score formula
CES = sum of all ratings ÷ number of responses
Share of easy experiences = answers from 5 to 7 ÷ all answers × 100
200 customers who have just moved home answer the broadband provider’s question:
| Rating | Answers | Points |
|---|---|---|
| 7 very easy | 74 | 518 |
| 6 | 53 | 318 |
| 5 | 33 | 165 |
| 4 | 15 | 60 |
| 3 | 14 | 42 |
| 2 | 6 | 12 |
| 1 very difficult | 5 | 5 |
| Total | 200 | 1,120 |
The CES here is 1,120 ÷ 200, which makes 5.6. Of the 200 movers, 160 found it easy, which is 80 per cent or four in five. 25 found it difficult: 12.5 per cent, or one customer in eight.
Suppose a rival provider scores the same 5.6, but its customers only ever picked two ratings: 144 gave a 7 and 56 gave a 2. Although the average matches, 28 per cent struggled there, well over a quarter. Only the share of easy experiences separates the two, so report it every time.
Tip
Before combining CES data from different tools or years, confirm the direction of each scale. Old figures from a tool that used 1 for low effort will otherwise be read upside down, turning a respectable 1.8 into an apparent emergency.
What makes a good CES?
How good a CES is depends, before anything else, on the scale behind it. These bands only hold for a 1 to 7 scale on which 7 stands for very easy. Our CES calculator uses them as a rough orientation for reading results, not as a fixed standard:
- 6.0 to 7.0: very good. Almost nobody has to try hard.
- 5.5 to 5.9: good. Most customers get through easily, with the odd snag.
- 4.0 to 5.4: room to improve. A sizeable group finds the process tiresome.
- 1.0 to 3.9: critical. The effort is far too high for many customers.
With 5.6, the home move process in the example lands in the good band. The CES becomes really useful once you line up your own processes against each other. If home moves score 5.6, updating payment details 6.3 and cancelling 3.4, the order of work is obvious. After each change, the next measurement shows whether the process genuinely got easier.
Effort is climbing the agenda in the UK. The Institute of Customer Service noted in its July 2026 UK Customer Satisfaction Index that being easy to deal with had grown in importance for many customers over the preceding six months. Regulation points the same way: under Ofcom’s One Touch Switch process, in place since September 2024, anyone moving broadband or landline to a different network only needs to contact the new provider, which takes care of the rest.
Careful
CES benchmarks circulate on five, seven and ten point scales, and some of them are reversed. No reliable conversion exists between them. Compare your CES only with results from the same question on the same scale, preferably your own earlier ones.
Create a survey for free
With empirio.ai you can create a modern online survey in minutes — with hosting in the EU.
- AI-built survey
- Adjust by drag & drop
- Real-time analysis
Where and when to ask the CES question
Because the CES rates a single process, the question should appear the moment that process ends: after the order confirmation, after an onboarding step, when a ticket is closed. The fresher the memory, the more exactly people can say where they got stuck.
Tacking the CES onto a big annual customer survey rarely works. Without a specific task to refer to, the answers become random. It belongs where processes happen: in the customer account, after checkout, at the end of a live chat. Our CES survey template uses the CES 2.0 statement and follows up with “Was your issue fully resolved?”
CES question checklist
- One question, one process, never the company as a whole.
- It appears as soon as the process is complete.
- Seven points, with labels at both ends.
- The direction of the scale is set once and kept.
- A second question confirms whether the issue was actually resolved.
- Reports always show the average and the share of easy experiences side by side.
Tip
Attach an open question to ratings from 1 to 3, for example “What made this hard work?”. People recall obstacles vividly, so CES comments tend to be very specific. Expect replies that name the exact field, link or phone menu option that needs fixing.
Strengths and weaknesses of the CES
Among customer metrics, the CES is the youngest of the big three and the most practical once a process needs fixing. Detail is its strength, the big picture its weak spot.
What the CES does well
- It shows where a process grinds, which other metrics tend to miss.
- In the 2010 research, it forecast repeat purchases in service better than CSAT or NPS.
- Low scores translate directly into jobs, like cutting a form down.
- The question can go out automatically whenever a process finishes.
- As an average, it registers even small gains.
Where the CES falls short
- Product, price and brand lie outside its scope.
- Scales and their direction vary, so external comparisons rarely hold.
- The average masks how many customers genuinely struggled.
- Effortless is not the same as solved, since a swift refusal can feel easy.
- Most of the evidence comes from contact centres and self-service channels.
What the CES leaves out
The CES was built to judge processes. It was never meant to sum up a whole customer relationship, and it does that job poorly.
Before you make it the headline figure for your service team, bear three limits in mind.
It cannot tell a right outcome from a wrong one
A request can be dealt with in two minutes and still be dealt with incorrectly. Applying for a refund was easy, the money never arrived. The effort score for that contact looks great, and the anger comes a fortnight later. So add a second question about whether the problem was completely sorted.
It judges transactions, not relationships
The authors of the Harvard Business Review article explained the predictive power of the CES by its focus on single transactions, in contrast to the NPS, which reflects an overall impression. Turn that round and the limit is clear: the CES says nothing about how a customer sees your company in general.
Its average rests on an assumption
A mean treats the gaps between points as equal, yet nobody can show that 2 to 3 covers the same distance as 6 to 7. In truth the answers are merely ranked, as on an ordinal scale. The average remains a handy shorthand, provided you read it as a direction and show the distribution beside it.
The CES spots the potholes. Whether the road leads anywhere worthwhile is yours to check.
How the CES fits alongside CSAT and NPS
Besides the CES, customer surveys mostly rely on two other metrics. Each looks at a different level, which is why they work well together:
- The CES asks how much effort a request took. It suits the end of processes such as an order, a return or a fault report.
- The CSAT (Customer Satisfaction Score) asks how satisfied someone was with an experience, expressed as a percentage.
- The NPS (Net Promoter Score) asks whether someone would recommend your company, which makes it a measure of loyalty overall.
For a side-by-side view and advice on when to use which, see our comparison of NPS, CSAT and CES.
Three mistakes that spoil CES data
A CES survey is simple to launch, yet three errors can render the results useless. For the groundwork behind any questionnaire, read the article 8 tips for creating the perfect online survey.
Asking about the brand rather than the task
“How easy is it to do business with us?” sounds like a CES question, but it asks for a general impression. You can’t link the answers to any process and are left guessing what to fix. Keep the question on the task the customer has just completed.
Changing the scale mid-series
Switching from the 2010 scale, where 1 meant little effort, to the current one, where 7 means very easy, breaks your time series. Log every change to wording or scale and start a fresh series, instead of blending old figures with new ones.
Chasing speed
Since the CES measures effort, speeding every contact up looks like the obvious fix. The 2010 authors advised the reverse: concentrate on solving the problem rather than on speed. A brisk call that forces the customer to ring back later increases effort instead of reducing it.
Conclusion
NPS and CSAT leave one question unanswered, and the CES fills the gap: how hard is it to be your customer? For anyone improving processes, no metric is more useful. Ask straight after the task, keep the scale and its direction untouched, report the share of easy experiences alongside the average and follow up on every 1 to 3. Do that, and the CES will tell you exactly which obstacle to remove next!
What to read next
- Building the CES into a wider survey? Customer surveys explained, with examples
- Got your results and want to analyse them properly? Evaluating a questionnaire in five steps
Want to see where your customers get stuck?
With empirio.ai, an online survey tool from Germany, you can create a customer survey in a few minutes and send the link the moment a process is complete. The CES template contains the effort statement plus the follow-up questions you need.