

Picture the income question in your survey, offered as tidy bands from “under £20,000” to “over £60,000”. Then a marker asks by what percentage one group earns more than another, and the honest answer is that your data cannot say.
Levels of measurement decide that. A ratio scale is a level of measurement whose values sit at equal intervals and whose zero marks the genuine absence of the property rather than an agreed starting point. Only that true zero makes a statement such as “twice as much” meaningful. By the end you will recognise ratio data and know how to collect it without giving the level away.
📌 The key points at a glance
- A ratio scale combines equal intervals with a true zero point.
- Weight, age, earnings and temperature in kelvin are ratio data.
- Only here do ratios and percentage change carry meaning.
- Coefficient of variation and geometric mean require a ratio scale.
- Banded answer options push your data down to ordinal level.
Create a survey for free
With empirio.ai you can create a modern online survey in minutes — with hosting in the EU.
- AI-built survey
- Adjust by drag & drop
- Real-time analysis
What is a ratio scale?
A ratio scale is the highest of the four classic levels of measurement: its values follow a fixed order, sit at equal intervals from one another and rest on a zero point that marks the absence of the property rather than a convention.
That zero is the only thing separating a ratio scale from an interval scale. It is also what turns the division of two measurements into a statement you can interpret. The University of Nottingham defines ratio values as ordered, with interpretable intervals and “a meaningful absolute zero”, and adds that multiplication and division should only be carried out on ratio measurements (University of Nottingham, Levels of Measurement). Graham Hole puts the boundary in one line for his Sussex undergraduates, “a ratio scale has a true zero point, whereas the interval scale does not” (Hole 2011, University of Sussex). Where the four levels sit relative to each other is covered in our guide to levels of measurement.
The classification goes back to the psychologist S. S. Stevens, who set it out in the journal Science in 1946. On ratio scales he notes that an absolute zero is always implied, even where the value zero is never actually produced (Stevens 1946). Your dataset does not have to contain a zero, then. It only has to be conceivable.
Ratio scale, ratio data, ratio level
British teaching material uses several labels for the same thing. “Levels of measurement” is the umbrella term, while the fourth step appears as ratio scale, ratio level or simply ratio data. The fixed phrase for the zero is “true zero” or “meaningful absolute zero”, not natural zero. If your supervisor uses one wording and your module handbook another, nothing has changed underneath.
Examples of ratio data
A characteristic is ratio scaled when it has a fixed unit and a zero nobody agreed on. The table gives five cases together with the statement the zero point makes legitimate.
| Characteristic | What zero means | Statement it allows |
|---|---|---|
| Gross weekly pay in pounds | no earnings | “£800 is twice as much as £400” |
| Age in years | no time lived | “45 years is three times 15 years” |
| Paid hours worked per week | no hours worked | “40 hours is double 20 hours” |
| Temperature in kelvin | lowest possible value | “600 K is twice 300 K” |
| Number of siblings | no siblings | “four siblings is four times one” |
Physics is where this level is the norm. Stevens writes in 1946 that ratio scales are the ones most commonly encountered in physics, and names counting itself as their simplest form. On psychological magnitudes his verdict is short: ratio scales there are rare.
A thermometer shows the split most quickly. Zero degrees Celsius marks the freezing point of water and is therefore a convention, whereas zero kelvin is the lowest value physically possible. The same temperature consequently sits on a ratio scale in kelvin and one level lower in Celsius.
Earnings behave the same way. Somebody with no job earns £0, and nobody agreed that figure. The Office for National Statistics collects gross weekly pay, gross hourly pay and total paid hours as amounts rather than bands in the Annual Survey of Hours and Earnings, which is what makes distribution measures and comparisons between regions possible at all.
Ratio scale or interval scale: where to look
One single difference separates the two levels, and it concerns the zero. Do not examine the characteristic, examine the zero value: if it means nothing is present, you have a ratio scale. If it was set so that measurement has somewhere to begin, you have an interval scale.
That test beats every rule of thumb in circulation. Whether negative values occur decides nothing, and the mere fact that something is recorded as a number decides even less. What matters is the meaning of the zero.
A date and a duration belong to different levels
A calendar year is interval scaled, an elapsed span of time is not. Stevens separates the two explicitly in 1946: calendar dates convert between calendars only through a linear transformation, whereas periods of time, in his wording, may correctly be described as double one another. For a questionnaire the consequence is direct. Ask for age in years when you want to report ratios, and for year of birth when birth cohorts are the point.
Negative values leave the ratio meaningless
A bank balance is often given as a ratio example, since £0 genuinely means no money. The argument holds only while no account is overdrawn. Minus £200 divided by £100 gives minus 2, and that number answers nothing. Measurement theory therefore assigns balances to the interval level (Klein 2004). With monetary variables, settle first whether negative values can occur at all.
What you can calculate with ratio data
Ratio data permits every procedure available at the lower levels, plus those that need a true zero. That addition covers percentage change, the coefficient of variation and the geometric mean.
| Calculation | Ratio scale | Reason |
|---|---|---|
| Mode and median | ✓ | available from nominal and ordinal level |
| Mean and standard deviation | ✓ | available from interval level |
| Ratio of two values | ✓ | zero marks a genuine absence |
| Percentage change | ✓ | a ratio written differently |
| Coefficient of variation | ✓ | spread divided by the mean |
| Geometric mean | ✓ | requires strictly positive values |
| Converting units, kilograms to pounds | ✓ | multiplication by a constant |
| Multiplying two measured values | ✕ | the product lands on a different scale |
The coefficient of variation is the measure tied most tightly to this level. It divides the standard deviation by the mean, and that quotient stays unchanged only when a change of unit multiplies every value by the same number. Stevens makes exactly this point in 1946: the ratio expressed by the coefficient of variation remains invariant only under the similarity transformation.
Stevens adds the geometric mean only in 1951
Coefficient of variation and geometric mean are regularly credited together to the 1946 paper. The 1946 table lists the coefficient of variation alone. The geometric mean arrives in Stevens' 1951 chapter, and the measurement-theoretic argument comes from Luce, as Ingo Klein sets out in his discussion paper for FAU Erlangen-Nürnberg. For a footnote in a dissertation that year matters.
Create a survey for free
With empirio.ai you can create a modern online survey in minutes — with hosting in the EU.
- AI-built survey
- Adjust by drag & drop
- Real-time analysis
Collecting ratio data in a questionnaire
Question wording decides your level of measurement, not the analysis that follows. An open numeric field gives you the full level, a list of bands gives you a rank order. Moving from fine to coarse stays possible later, the other direction never does.
Research reaches for this level wherever exact values matter, in reaction times or body measurements for instance. In a survey, ratio data appears whenever you ask about quantities, durations or amounts: body weight in a nutrition study, gross pay in a labour market study, weekly hours of use in a media study.
A single question makes the difference visible. “How much do you spend on food each month?” with the options “£100 or less”, “£150”, “£200” and onwards returns ordered bands. The same question with an empty numeric field returns amounts you can average, compare in percentages and divide by one another.
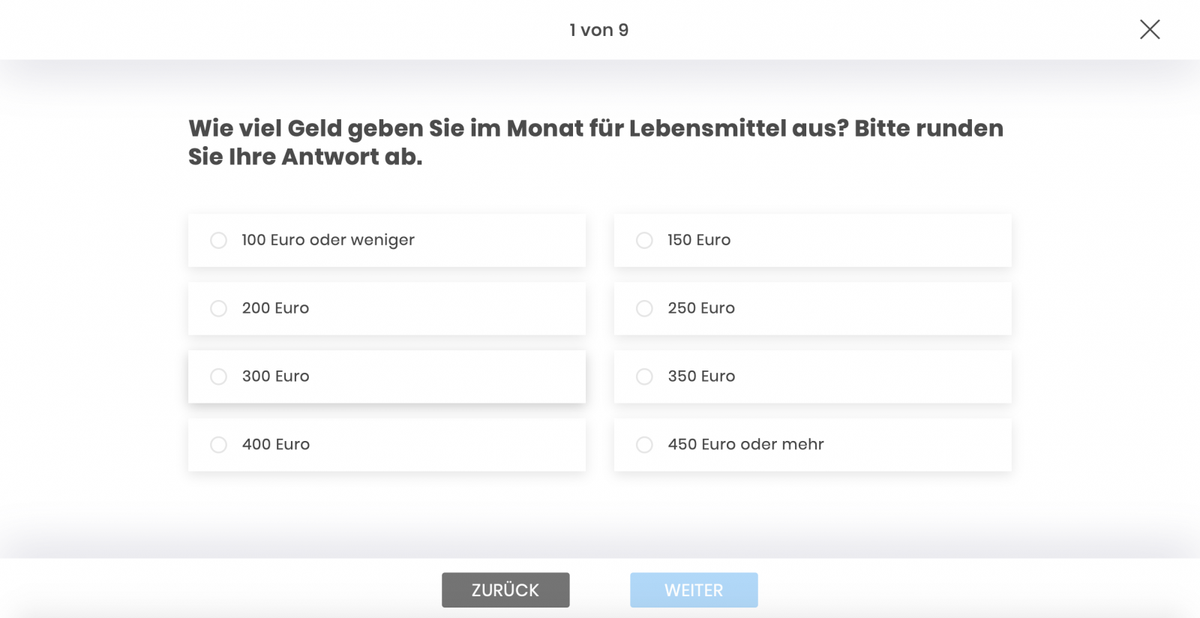
Bands remain popular for a reason worth acknowledging: with income, weight and age, more people will tick a box than type a figure. The Office for National Statistics avoids the trade-off by drawing earnings from payroll records rather than from a question, which is not an option in a student project. Make the choice deliberately and record it in your methodology chapter.
💡 Tip
If you need bands so that people answer at all, create them during analysis. Collect the open figure and group it afterwards. “£1,000 to £2,000” will never turn back into an amount.
Three mistakes that keep recurring
Most errors happen a step before the calculation: a characteristic is filed at a level its data never reached, and everything downstream inherits that decision.
All three cases share one trait. The data table gives nothing away, the software calculates without complaint, and only the finished sentence in the results chapter turns out to be nonsense.
Collecting income and age in bands
Bands feel considerate and cost an entire level of measurement. “£1,000 to £2,000” yields neither a mean nor a ratio, because the true value inside the band stays hidden. Anyone who calculates regardless silently substitutes the band midpoint and claims a precision the survey never had.
Reading scale points as measurements
A 0 to 10 answer scale looks like ratio data and is not. A 10 does not represent twice the satisfaction of a 5, because equal intervals between the points cannot be demonstrated. Strictly speaking such scales sit at ordinal level; how to analyse them properly is covered in our guides to the rating scale and the Likert scale.
Taking a geometric mean across zero values
No errors, no points, no purchases: on a ratio scale zero is an ordinary value and an awkward one to calculate with. The geometric mean multiplies every value together, so a single zero drags the result to zero. Inspect your distribution before choosing it, and fall back on the median or the arithmetic mean.
Ratio scale or absolute scale?
A ratio scale leaves the unit of measurement open, an absolute scale does not. Weight can be given in kilograms or in pounds, a count only in items, and that is exactly where the two levels part company.
Absolute characteristics are therefore a special case of the ratio scale: they meet all of its conditions and add one more. Ingo Klein notes in his discussion paper for FAU Erlangen-Nürnberg that on an absolute scale only the identity transformation remains admissible, so it cannot be converted at all. Nothing changes for the analysis, both levels permit the same calculations. How to spot such characteristics in a questionnaire is covered in our guide to the absolute scale.
Conclusion
A ratio scale is the level at which statistics is allowed everything, and in a questionnaire it hangs on one decision: an open numeric field instead of convenient bands. That decision is made before you send the survey out, never afterwards.
Your level of measurement is set by the wording of the question, not by the analysis.
Where to go next
- Want the four levels side by side? Levels of measurement
- Need the boundary below this one? Interval scale
- Wondering when a count is absolute? Absolute scale
- Looking for the right question format? Question types in a questionnaire
Reading tip: S. S. Stevens (1946): On the Theory of Scales of Measurement, in: Science 103, pp. 677 to 680. Four pages in which the four levels appear side by side for the first time, and still the cleanest source for any footnote on the subject.
Want to set your questions up properly from the start?
With empirio.ai, an online survey tool from Germany, you assemble a questionnaire in a few minutes and try it on a handful of people before the real fieldwork begins.