

Try a small test. Two sentences about the same thermometer: “Yesterday it was 10 degrees, today it is 20 degrees, so it has got 10 degrees warmer.” And: “Today it is twice as warm as yesterday.” The first holds, the second is nonsense.
The reason is called the interval scale. An interval scale is a level of measurement on which the gaps between the values are equally large everywhere, while the zero point was set by convention and marks no true absence. Differences and means are fair game, ratios such as “twice as much” are not. By the end you can decide, for every question in your questionnaire, whether to report a mean or the frequencies.
📌 The key points at a glance
- An interval scale has equal intervals but no natural zero point.
- Degrees Celsius, calendar years and IQ scores are interval data.
- Differences, means, standard deviations and correlations are permitted.
- Ratios, percentage change and the coefficient of variation are not.
- Rating scales in a questionnaire are strictly speaking ordinal.
Create a survey for free
With empirio.ai you can create a modern online survey in minutes — with hosting in the EU.
- AI-built survey
- Adjust by drag & drop
- Real-time analysis
What is an interval scale?
An interval scale is a metric level of measurement on which the distances between neighbouring values are equally large, while the zero point has been fixed by agreement and does not stand for a true absence. The name goes back to the Latin intervallum, meaning gap or distance.
Compared with the two weaker levels, an interval scale can do one thing more. Categories are told apart as on the nominal scale and ordered as on the ordinal scale. On top of that, it says by how much two values differ.
The four levels of measurement go back to the psychologist S. S. Stevens, who described them in the journal Science in 1946. For the interval scale he notes that the zero point is “a matter of convention or convenience” (Stevens 1946). Everything else hangs on that.
On an interval scale you can compare distances. Ratios you cannot.
Where the interval scale sits among the other three levels is covered in our guide to the levels of measurement.
Examples of the interval scale
Interval data come from variables with a fixed unit whose zero point was set by people: temperature in degrees Celsius, calendar years and test scores such as the IQ. The overview shows what each agreed zero rests on.
| Example | Where the zero comes from | What does not follow |
|---|---|---|
| Degrees Celsius | freezing point of water, by definition | “20 degrees is twice as warm as 10” |
| Calendar year | starting point of the calendar in use | “The year 2000 is double the year 1000” |
| IQ score | population average, fixed at 100 | “IQ 140 is twice as clever as IQ 70” |
A thermometer makes the idea concrete. Between 5 and 20 degrees Celsius lie 15 degrees, and between 40 and 55 degrees the same 15 degrees. Zero, however, marks the point at which water freezes and not the absence of temperature. A year of birth behaves the same way: a year zero in the sense of “no time at all” never existed.
With the IQ the agreement is even more obvious, because the average of the scale was fixed at 100. Graham Hole puts it bluntly in the research skills handout of the University of Sussex, “There is no true zero point on an IQ test”, so someone scoring 140 is not twice as intelligent as someone scoring 70 (Hole 2011, University of Sussex).
Strictly speaking, the IQ carries the same caveat as a rating scale: the equal steps come from the way the scale was standardised, not from the measurement itself. Stevens still counted intelligence tests among the ordinal scales that aim at interval level.
Interval scale or ratio scale: how to tell them apart
Interval scale and ratio scale differ in exactly one place, namely the zero point. A ratio scale has a natural zero that marks a true absence, an interval scale does not. Equal intervals and a fixed order belong to both.
Graham Hole reduces the distinction to one line for his students, “a ratio scale has a true zero point, whereas the interval scale does not”. One phenomenon can therefore sit on two levels depending on the unit. Temperature in degrees Celsius is interval data, the same temperature in kelvin is ratio data, because 0 K is the lowest value there is and only there may you call one value twice as high as another. The full comparison is in our guide to the ratio scale.
The zero point decides, not the minus sign
Many summaries claim that an interval scale can be recognised by negative values. Celsius happens to fit, yet the idea fails as a test. The IQ is interval data and never goes negative. What matters is whether the zero was set or is natural.
A date and a duration sit on different levels
A date is interval data, a duration is ratio data. Stevens described the two side by side in 1946: calendar dates convert between calendars only by a linear rule, while for durations he writes that “one period may be correctly defined as double another”.
For your questionnaire that is the decisive point, because the wording fixes the level of measurement. Ask for the year of birth and you get interval data, ask for age in years and you get ratio data, since zero years of lived time is a true absence. Same person, same information, two levels.
What you are allowed to calculate with interval data
Interval data allow every procedure that works with distances and rule out every procedure that needs the zero point. Stevens set out the allocation in a table in 1946, and the overview below translates it into the calculations you meet in a real analysis.
| Calculation | Interval scale | Reason |
|---|---|---|
| Mode and median | ✓ | Mode from nominal, median from ordinal |
| Difference between two values | ✓ | intervals are equal across the range |
| Mean and standard deviation | ✓ | need equal intervals, not a zero point |
| Pearson correlation | ✓ | works with deviations from the mean |
| Ratio, so “twice as much” | ✕ | meaningless without a true zero point |
| Percentage change | ✕ | a ratio written in another form |
| Coefficient of variation | ✕ | divides the spread by the mean |
| Geometric mean | ✕ | multiplies the values with each other |
Procedures built on the mean and the spread therefore assume at least an interval scale. The Sussex handout lists exactly that pairing: median, mode and mean as descriptive statistics, plus parametric tests such as the t-test and ANOVA. Ordinal variables are left with the median, quartiles and rank correlations. Stevens himself still placed rank correlation on the interval scale in 1946; today it counts as the standard method for ordinal data.
Convert in a linear way only
An interval scale survives as long as you multiply every value by the same positive number and add the same number. Celsius into Fahrenheit works exactly like that: times 1.8, plus 32. Squaring or taking logarithms destroys the equal intervals and with them the level of measurement.
Out of that follows a common trap. A difference of 10 degrees Celsius is not a difference of 10 degrees Fahrenheit but of 18, because the factor 1.8 acts on the distances while the added 32 only shifts the zero point.
Create a survey for free
With empirio.ai you can create a modern online survey in minutes — with hosting in the EU.
- AI-built survey
- Adjust by drag & drop
- Real-time analysis
Is a rating scale in a questionnaire an interval scale?
A rating scale in a questionnaire is strictly speaking ordinal, because nobody can show that the step from “somewhat agree” to “agree” matches the step from “agree” to “strongly agree”. In practice such scales are analysed as interval data very often.
The gap between theory and practice is not new. Stevens described it himself in 1946 and noted that a “kind of pragmatic sanction” can be invoked for computing means on ordinal data. In the same paragraph he names the condition: the error grows to the degree that the intervals are unequal.
Five design points that make equal intervals more plausible
Careful design turns a rough ordinal scale into something that at least behaves like an interval scale. None of the points below proves equal intervals, yet together they make the assumption easier to defend.
- Five to seven response options, so respondents can tell them apart.
- An equal number of positive and negative options.
- Every option labelled, not only the two ends.
- No negative numbers as markers, since they pull answers upwards.
- Equal visual spacing between all options.
Choosing the words is the hardest part, because wording that reads as evenly spaced to you may read as lopsided to a first-year undergraduate. How to build a workable scale is in our guide to the rating scale, agreement wording in the guide to the Likert scale.
Likert data in British methods courses: a grey area
British methods courses frequently set their students a stricter rule than published research follows. Marking criteria on a psychology module can require Likert answers to be treated as ordinal data, while journals in the same field print t-tests on exactly that kind of scale.
Graham Hole leaves his Sussex undergraduates no room for interpretation: on that course ratings count as ordinal, only nonparametric tests are accepted, and a parametric test on ordinal data is marked wrong. His verdict on the underlying question is just as short, “Therefore this is an ordinal scale.” The same handout then concedes that “this is a grey area” once you look at what researchers publish (Hole 2011, University of Sussex).
For your own dissertation the rule that counts is the one in your module handbook, not the one in the last paper you read.
- Check the module handbook or the practical slides before you pick a test.
- Ask your supervisor in writing when handbook and lecture slides disagree.
- Name the decision in your methods section with one sentence of reasoning.
⚠️ Warning
Never mix the two policies inside one dissertation. A t-test on agreement ratings in one chapter and a Mann-Whitney test on the same ratings in another leaves your marker no way of telling which level you claimed.
Using an interval scale in a questionnaire: five steps
Whether you end up with interval data is decided when you build the questionnaire, not when you analyse it. Afterwards a variable can only be converted downwards, from fine to coarse, never back. The five steps below make the decision a conscious one.
- Define the variable. Write down in one sentence what is measured, for example satisfaction with the campus canteen.
- Choose the response format. A free number field, a graded scale or categories each deliver a different level.
- Build the steps evenly. Five to seven options, symmetrical, without negative numbers, equally spaced.
- Test the scale. Ask five people from your target group to put the options into their own words.
- Decide the analysis in advance. Settle now whether you will report means or frequencies.
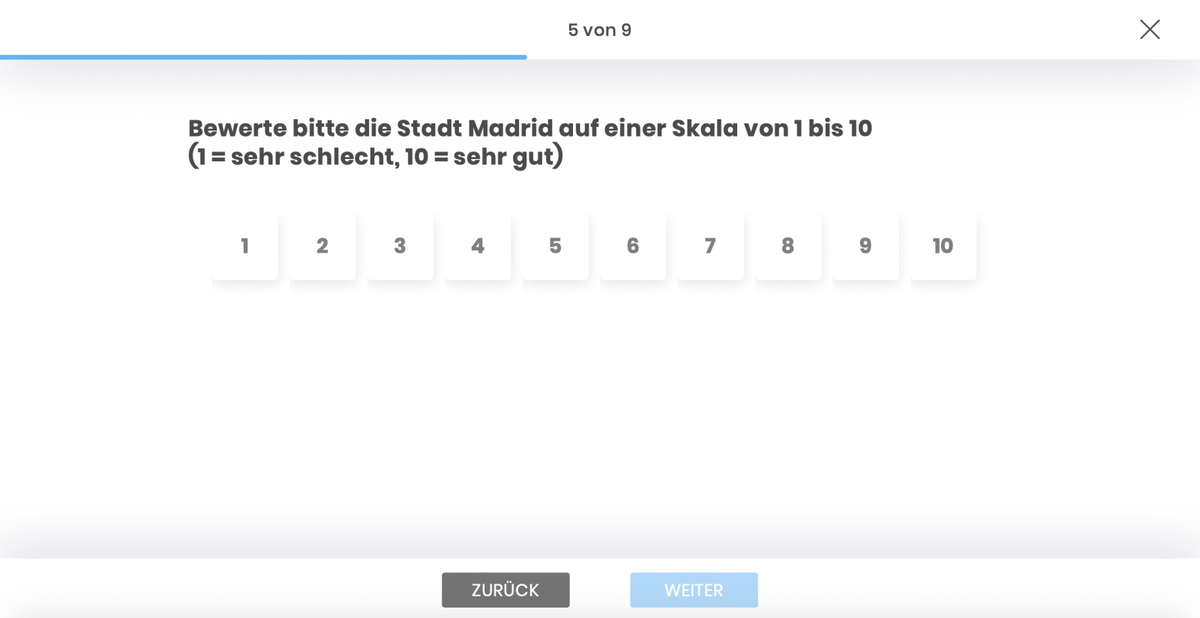
Step four is skipped most often and pays off most. If two out of five testers read “slightly agree” differently from you, the assumption of equal intervals is gone before the first real answer arrives. With empirio.ai, an online survey tool from Germany, you can change the options after a pretest without rebuilding the questionnaire.
💡 Tip
Collect age, income and duration as a free number rather than in bands. From a free number you can build bands at any point, from bands you can never get the number back. A student income in pounds also survives a marker asking for the median.
Common mistakes with the interval scale
Most mistakes around the interval scale happen when a variable is filed on the wrong level, not when the sums are done. Four cases turn up especially often.
Taking minus values as the giveaway
Negative values are a hint, not a proof. The IQ is interval data and never goes negative, because the scale is built around 100. The other way round, temperature in degrees Celsius stays interval data even if a summer data set contains no reading below zero at all. Always check the zero itself: does it stand for “nothing present” or for an agreed starting point?
Reading GCSE grades as an interval scale
GCSE grades in England run from 9 down to 1, with 9 as the top grade, so the scale points the opposite way to most continental systems. Nothing guarantees that the gap between a 4 and a 5 matches the gap between an 8 and a 9, which makes the grades ordinal and a grade average a convenience. Wales, Northern Ireland and Scotland award grades differently again, worth a sentence in your methods section.
Mixing up a date and a duration
A year of birth is interval data, age in years is ratio data. Treating both as the same thing produces sentences no marker will accept. Ask for age from the start when you want to report ratios.
Calculating percentages on interval values
A sentence such as “the temperature rose by 50 per cent” sounds harmless and is not. A percentage change divides the difference by the starting value and is therefore a ratio. From 10 to 15 degrees Celsius is plus 50 per cent, the same warming in Fahrenheit plus 18. Report the difference in degrees.
Conclusion
The interval scale is the level at which statistics becomes comfortable: mean, standard deviation and correlation are all permitted, and for most analyses that is plenty. The price is the agreed zero point, and it costs exactly one kind of statement, the ratio. Keeping that in mind leads to better questionnaire decisions than reciting the four levels.
Where to go next
- Want to see how the four levels fit together? Levels of measurement
- Missing the boundary at the top? Ratio scale
- Building a response scale right now? Rating scale
- Working with agreement ratings? Likert scale
Want to try your response scales straight away?
With empirio.ai you can build a scale in a few minutes, send it to five testers and adjust the options before the real survey starts.