

The HR manager of a retail chain in Manchester opens the results of this year’s staff survey and finds two numbers side by side. The stores come in at −9, head office at +24. Same company, same payslips, same question. So which figure tells the truth, and what are you meant to do with either of them?
The Employee Net Promoter Score is a metric for measuring how loyal employees are to their employer. You ask your staff how likely they would be to recommend the company as a place to work, on a scale from 0 (very unlikely) to 10 (very likely), sort the replies into promoters, passives and detractors, then deduct the detractor share from the promoter share. What you are left with sits somewhere between −100 and +100. Below we show you how to word the question so that nobody worries about being identified, how to work out the score from your own figures and at which point it stops telling you anything useful.
📌 Key points at a glance
- The eNPS measures staff willingness to recommend their employer (0 to 10).
- Promoters give 9 or 10, detractors anything from 0 to 6.
- eNPS = % promoters − % detractors, the passives (neutrals) drop out.
- Possible scores go from −100 (negative) to +100 (positive).
- According to Bain, companies most often collect it monthly.
Create a survey for free
With empirio.ai you can create a modern online survey in minutes — with hosting in the EU.
- AI-built survey
- Adjust by drag & drop
- Real-time analysis
What is the eNPS?
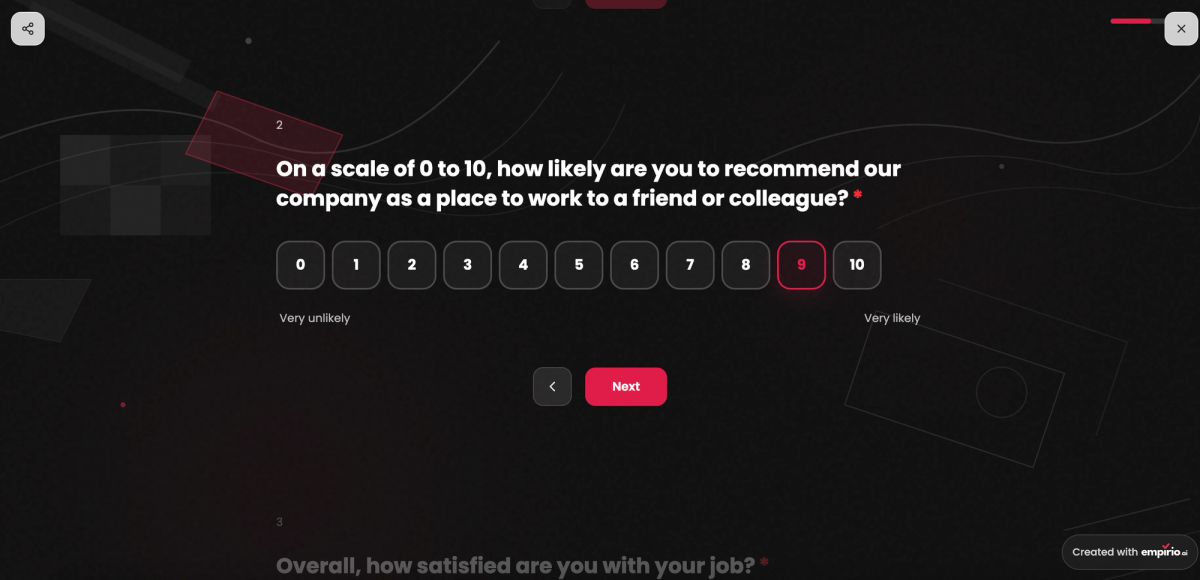
The Employee Net Promoter Score, eNPS for short, takes the Net Promoter Score and turns it inwards on your own workforce. It too rests on one single question:
“How likely is it that you would recommend our company to a friend as a place to work?”
People answer on a scale from 0 (very unlikely) to 10 (very likely), and only the two ends carry a label.
The method has its roots in customer research. Bain & Company, the firm where Fred Reichheld came up with the NPS, describes on its Employee Net Promoter System page how businesses apply the same thinking to their own staff. Apple appears there as one of the companies that settled on the recommendation question, and Bain is candid that the eNPS is still an emerging science. Two points from that page are useful before you start. First, staff often rate their employer considerably lower than customers do, since insiders expect more of the place. Second, Bain rates the recommendation question as its strongest predictor of who stays, but for a sense of how energised people feel it adds a second statement, roughly “My job inspires me”.
One legal footnote: “Net Promoter” and “NPS” are registered trademarks held by Bain & Company, NICE Systems and Fred Reichheld. Asking the question inside your own organisation needs nobody’s permission. A licence from Bain only comes into play if you use the names commercially, for instance to brand a product you sell.
The difference between “recommendation” and “employee satisfaction”
Satisfaction is about how content someone is with their wages, their manager or their day-to-day tasks. The eNPS question goes a step further: would they vouch for the place to a friend who is looking for work? Many satisfied people would hesitate. A steady job with decent pay can keep a person loyal without turning them into an ambassador.
Promoters, passives (neutrals) and detractors: the three groups
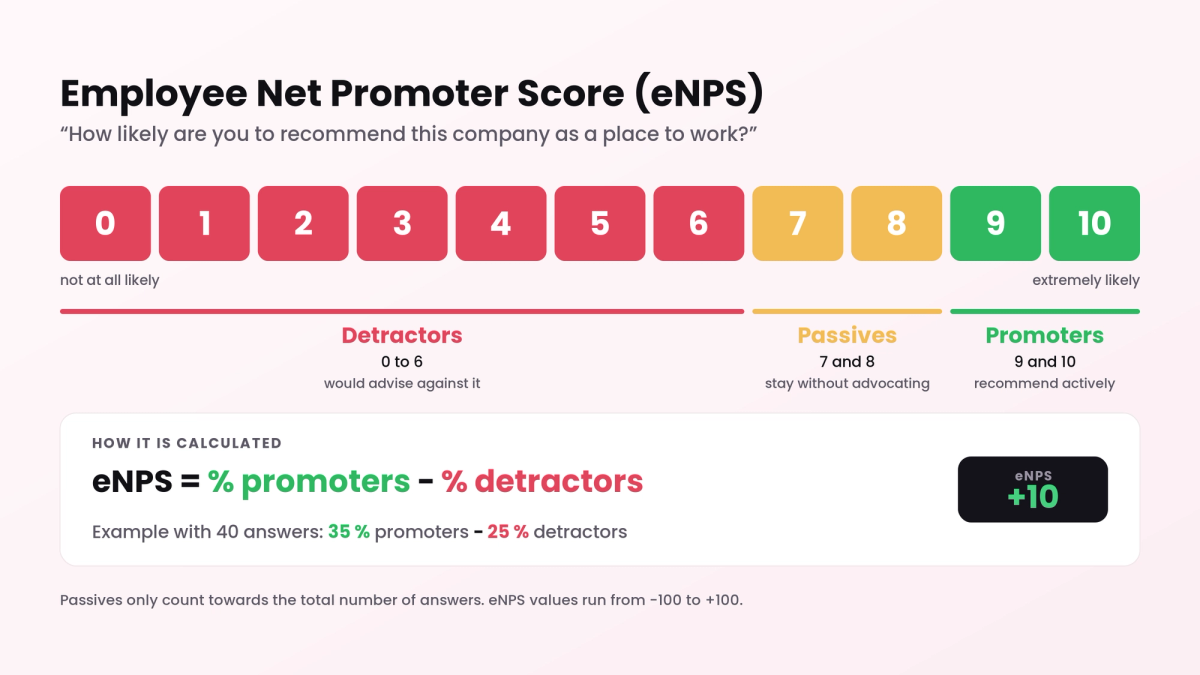
When you analyse the results, the eleven points on the scale fold into three groups. The cut-off points match the customer version exactly:
- Promoters with 9 and 10: would talk the company up to friends and often bring new colleagues through the door.
- Passives (neutrals) with 7 and 8: happy enough to stay put, although a tempting offer from a rival employer would set them thinking.
- Detractors with 0 to 6: more likely to warn people off, and some of them already have one foot out of the door.
Drawing the line at 9 feels harsh, particularly inside a company. Someone who gives a 7 at work often means something like “it’s fine, I suppose”, and that lukewarm fine is exactly what the eNPS sets out to separate from real conviction. A large block of passives is therefore no cause for comfort. It points to loyalty that could give way the moment a better offer turns up.
Strictly speaking the scale is a rating scale with eleven points. That is why the eNPS works with shares rather than averages: a mean of 7.4 tells you nothing about how many of your people are actually convinced.
Tip
The same logic exists for customers, where it goes by the name Net Promoter Score and asks whether people would recommend a product, a service or a business. The groups and the arithmetic are identical. What changes is who you ask and how you read the answer.
Calculating the eNPS: formula and worked example
You calculate the eNPS by taking the percentage of detractors away from the percentage of promoters. Passives count towards the total number of answers but play no part in the formula itself. The result is usually rounded to a whole number and written without a per cent sign.
- Count the answers. How many people chose 9 or 10, how many 7 or 8 and how many anything from 0 to 6?
- Turn the counts into percentages. Divide each count by the number of answers overall, then multiply by 100.
- Take one from the other. The promoter percentage minus the detractor percentage is your eNPS.
Got the three group totals to hand? Then let our eNPS calculator do the sum, and it will show you the shares and the rating band as well.
Formula for the Employee Net Promoter Score
eNPS = promoters in % − detractors in %
Share of a group = answers in that group ÷ all answers × 100
Suppose 80 members of staff from one region of the chain reply:
| Group | Answers | Share |
|---|---|---|
| Promoters (9 to 10) | 24 | 30 per cent |
| Passives (7 to 8) | 36 | 45 per cent |
| Detractors (0 to 6) | 20 | 25 per cent |
| Total | 80 | 100 per cent |
30 per cent promoters minus 25 per cent detractors gives an eNPS of +5. The 36 passives never appear in the sum, yet they still matter: they swell the total and so shrink both of the other shares.
A second region also returns 80 answers, but the split looks nothing alike: 42 promoters, not a single passive and 38 detractors. 52.5 per cent minus 47.5 per cent is +5 once more. One score, two very different places to work, a calm and middling workforce in the first case, a deeply divided one in the second. So whenever the eNPS goes out, put the three shares and the response count right next to it.
Tip
Hold back any breakdown by store, region or department until each group has five answers or more. With fewer, colleagues can piece together who said what, and the next survey will collect polite answers instead of honest ones.
What is a good eNPS score?
No single cut-off makes an eNPS good. Your sector, the size of the business and how tight the labour market is all push the figure around. Staff also know the company from the inside and mark it down harder than customers would, which is why an eNPS normally lands lower than a customer NPS. To give you a rough bearing, the eNPS calculator on empirio.ai groups scores into five bands, meant as a reading aid and nothing more:
- −100 to −21: critical. Detractors heavily outweigh promoters. Stop surveying and start having conversations.
- −20 to −1: room to improve. The critics are ahead, and the open comments usually say why.
- 0 to +19: solid. The two camps are more or less evenly matched.
- +20 to +39: good. You have noticeably more fans than critics.
- +40 to +100: very good. A big chunk of your staff would happily sell the company to a friend as an employer.
So the +5 from the regional example is a perfectly solid result for a workforce. The direction of travel tells you more than any band: stores moving from −9 to +3 across two surveys say more than a one-off +20 with nothing beside it. Comparing within the business works just as well. Head office at +24 and the shop floor at −9 tells you which door to knock on first.
Careful
Published eNPS benchmarks by sector are almost always produced by HR software firms from their own client base, and they seldom explain how those figures were gathered. Measure yourself against your own last result instead.
What if your score is poor? A result below zero says nothing about you as a manager. Treat it as a brief. Work through the open comments first, where the same three or four issues will usually keep surfacing, deal with them visibly and survey again after three months.
Create a survey for free
With empirio.ai you can create a modern online survey in minutes — with hosting in the EU.
- AI-built survey
- Adjust by drag & drop
- Real-time analysis
How to ask the eNPS question in a questionnaire
Comparable scores depend on keeping the wording, the scale and the timing fixed from one round to the next. Change the phrasing between waves and every wave ends up measuring something slightly different.
The position of the question colours the answer as well. Put it after a dozen detailed items about rotas, the staff room and parking and people will answer with those details in their heads rather than the whole picture. Either give it a short pulse survey of its own or save it for the last page of a full employee survey. Our pulse survey template offers a ready-made frame of five questions in all, among them the eNPS item, the three core work engagement statements and an open prompt.
Anonymity, data protection and employee representatives
Anonymity is the foundation the eNPS stands on. Collect only the characteristics you really want to break results down by, and say up front how big a group must be before its figures appear. How to set up an anonymous survey is explained step by step in our guide. Unlike Germany or the Netherlands, Britain has no works council whose consent a staff questionnaire needs. The legal frame comes from UK GDPR instead. Answers that cannot be linked to anyone count as anonymous information, and the ICO’s guidance on anonymisation is clear that data protection law does not apply to it. If store, role and length of service together point to one person, though, the answers are still personal data and the usual rules apply. Where you recognise a trade union, bring its representatives in early. No law requires this for a survey, but Acas calls voluntary consultation of this kind “good practice consultation” and notes that it helps to build trust.
Checklist for the eNPS question
- Same wording every time, with the phrase “as a place to work” in it.
- Answers go from 0 to 10, labelled only at the two extremes.
- Straight underneath comes an open question asking why.
- It either runs as a standalone pulse or comes last in the long survey.
- No demographic question narrows the answers down to individuals.
- Staff know the survey dates before the first wave goes out.
Tip
Add an open question right beneath the scale, such as “What is the main thing behind your score?”. With staff it earns its place even more than with customers, because anonymity means there is nobody you can ring back later. If the questionnaire doesn’t capture the reason, it is gone for good.
On timing, Bain says that monthly is what companies most commonly go for. A quarterly or half-yearly cycle is fine too, provided you keep to it. Readings taken at regular intervals add up to a trend line. Readings taken whenever somebody happens to think of it are just a scatter of numbers.
Advantages and disadvantages of the eNPS
The eNPS has fans in HR because it is cheap to run and needs no explaining. A fair number of directors are sceptical of it for the very same reason, and neither side is entirely wrong.
Arguments for the eNPS
- A rating plus one open question is done in under a minute, so it hardly eats into anyone’s shift.
- As a pulse every one to three months, it shows quickly if morale sags after a restructure.
- Given enough responses, stores, regions and head office can be compared like for like.
- It uses the same logic as the customer NPS, so both kinds of loyalty can share one dashboard.
- Nobody in the boardroom needs the figure explained to them.
Arguments against the eNPS
- Small teams make it volatile: with 16 answers, a single detractor who becomes a promoter shifts the score by 12.5 points.
- The moment staff suspect they can be identified, the answers get suspiciously rosy.
- Passives disappear from the calculation, although they are the group most easily tempted away.
- On its own the figure gives no reasons, and without an open follow-up it stays mute.
- Industry averages from the internet lure you into comparisons that prove nothing.
What the eNPS won’t tell you
Think of the eNPS as a mood reading rather than a diagnosis. Treat it like a full staff survey and you will be waiting for answers it was never built to give.
Before the number goes into a board pack, it helps to know three limits.
It can’t tell you the reason
Pay, line management, shift patterns or the hybrid working policy: the score only shows that something is holding back people’s willingness to recommend. The actual cause sits in the open comments or in a more detailed survey. Our separate article explains how to measure employee satisfaction without resting everything on one figure.
Small numbers make it unreliable
Roughly speaking, the score becomes usable from about 20 responses and settles down from about 50. With a team of eight, a frank chat over a brew will teach you more than any metric. Once you split results by department, keep to at least five answers per group, or the figures start to identify individuals.
It records intention, not action
The recommendation question is a reasonable pointer to loyalty. Yet a 9 does not mean anyone has actually been recommended, and a 5 does not mean a resignation letter is on its way. Timing colours the result as well: the week after the annual pay rise lands looks rosier than the week a restructure is announced.
The eNPS shows you that something has shifted. The open answers show you what.
The eNPS compared with other workforce metrics
The eNPS sits alongside several other ways of tracking how staff feel. Its closest relatives:
- The NPS shares the question, scale and formula but asks customers. Its scores usually run higher, and because customer answers need not be anonymous, you are free to ring back a disgruntled customer and ask what went wrong.
- Employee satisfaction is normally captured through a set of questions on the job, line management and conditions, and it pinpoints where the friction is. The eNPS squeezes all of that into a single recommendation.
- Work engagement looks at energy and commitment in everyday work, meaning how much of themselves someone puts into the job. A high eNPS can go hand in hand with low engagement, say in a job that is safe but dull.
Typical mistakes in eNPS surveys
Where eNPS surveys go wrong, it is rarely the formula and nearly always the set-up around it. General advice for better questionnaires is in our tips for better online surveys. With the eNPS, three slips crop up more than any others.
Recommendation quietly becomes satisfaction
“How satisfied are you with us as an employer?” looks like a small tweak and measures a different thing. Drop the recommendation and you no longer have an eNPS. Shortening the scale to 1 to 10 does the same damage: the new figures no longer match anything you measured before.
Tiny groups appear in the report
A store with three responses shown on its own is not a statistic. Everyone in that team can guess who wrote what. Anyone who sees their answer traced back once will be guarded next time or skip the survey altogether, and every later wave pays the price.
Nothing happens after the survey
Survey people and then say nothing, and the next response rate will show it. Within a few weeks, talk openly about the two or three biggest issues from the comments, even if you haven’t solved them yet. Knowing they were heard often matters more to staff than the eventual fix.
Conclusion
The eNPS is about the simplest measure you can take of your workforce, which is exactly where its usefulness starts and stops. One question, one figure, a line over time: that is enough to spot early when the mood turns, and not enough to explain it. Ask it in the same words every time, follow it with the open question, stick to a set rhythm and benchmark only against yourself. Then the eNPS works less like a school report and more like an early warning, giving you time to act before the resignation letters land!
Where to take it from here
- Results in and ready to dig into them? Evaluating a questionnaire step by step
- Wondering where else a survey could help? What surveys are used for
Ready to measure your team’s eNPS?
empirio.ai is an online survey tool from Germany. You can build your employee survey in a few minutes, keep every response anonymous and let the analysis calculate the score for you. The eNPS question is already part of the employee satisfaction template.