

In January 2002 the Pew Research Center asked half its sample whether the US president should focus more on domestic policy or foreign policy. Domestic policy won comfortably. For the other half the same answer category was labelled “the war on terrorism” instead of “foreign policy”, and the majority flipped.
Closed-ended questions are questions in a questionnaire or interview where every answer option is supplied in advance: the respondent picks from a fixed list, ticks a point on a scale or chooses between two alternatives instead of writing the answer themselves. We will show you which types exist and how to spot when your answer list is shaping the result.
📌 The key points
- Closed-ended questions supply every answer option in advance.
- The answer list changes the result, not just the format.
- Answer categories must be exhaustive and mutually exclusive.
- Five to seven points is the accepted optimum for rating scales.
- The average reading age in the UK is around nine.
Create a survey for free
With empirio.ai you can create a modern online survey in minutes — with hosting in the EU.
- AI-built survey
- Adjust by drag & drop
- Real-time analysis
What are closed-ended questions?
A closed-ended question is a question in a survey where every answer option is supplied in advance. The respondent selects from the given categories and does not phrase the answer in their own words.
The GESIS Survey Guidelines by Timo Lenzner and Natalja Menold (2015) distinguish three answer formats rather than two. Closed-ended questions split into two quite different groups: those with a rating scale, where the categories follow a gradation, and those without one, where the answers simply sit side by side as a list.
The split between scale and list is practical, not academic. A rating scale comes with its own rules on the number of points and the middle category; an answer list comes with rules on completeness and order. Treat them as one thing and you apply the wrong rules, then puzzle over the distribution.
| Answer format | What is supplied | Example |
|---|---|---|
| Open-ended question | nothing, just a text box | What was missing from the lecture? |
| Closed-ended question with rating scale | graded categories on one dimension | very satisfied to very dissatisfied |
| Closed-ended question without a scale | a list with no gradation | Which qualification are you working towards? |
Every question format and its subtypes appear in the overview of question types in a questionnaire. If you would rather work out which of the two basic forms suits your project, the direct comparison of open and closed questions is the place to start.
Types of closed-ended questions
Closed-ended questions sort along two features: how many answers the respondent may give, and whether the categories stand in a rank order. That produces five forms which turn up in almost every questionnaire.
The labels for these five forms differ by tool. Sometimes the two most common are called multiple choice and checkboxes, sometimes single answer and multiple answer. The underlying format is the same.
| Question type | How many answers | Example |
|---|---|---|
| Dichotomous question | exactly one of two | Have you ever taken part in a survey? |
| Single-choice question | exactly one of several | Which qualification are you working towards? |
| Multiple-choice question | any number from a list | Which languages do you speak? |
| Rating scale | one point on a gradation | How satisfied were you with the supervision? |
| Ranking question | all items, placed in order | Rank five criteria by importance |
One stubborn misunderstanding surrounds the dichotomous question. You will often read that it can also carry four graded answers from “strongly support” to “strongly oppose”. A question like that is no longer dichotomous: dichotomous means split in two, so exactly two categories. Four graded points make a rating scale, and different rules apply there.
Multiple-choice questions: several answers at once
In a multiple-choice question the respondent may tick several answer options at the same time. That makes sense whenever the categories do not exclude one another, such as languages spoken or devices used. The cost shows up in the analysis: the percentages no longer add up to 100, because each person is counted more than once.
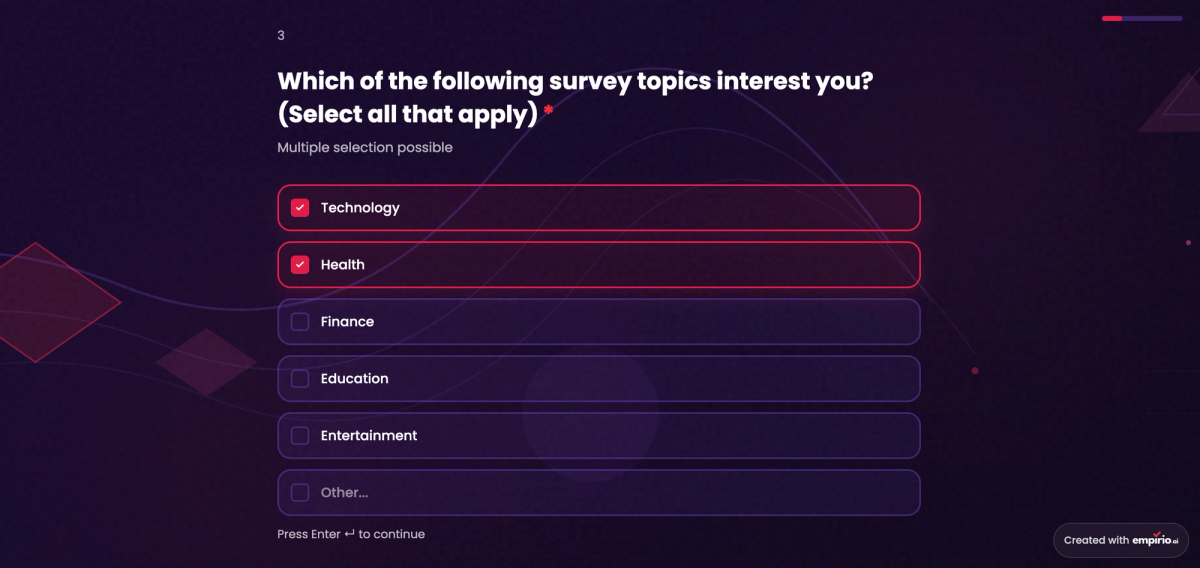
How to build these questions and which traps wait at the analysis stage is covered in detail in the article on multiple-choice questions.
Single-choice questions: exactly one answer
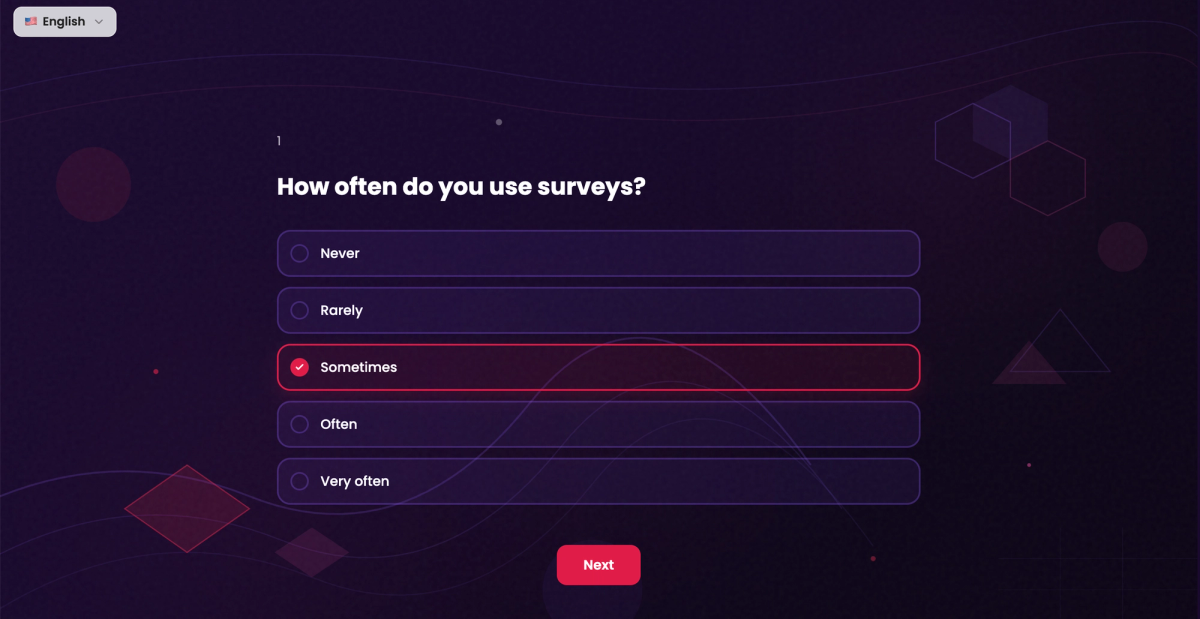
In a single-choice question the respondent settles on exactly one answer option. This form assumes the categories genuinely exclude one another, otherwise the respondent faces two equally correct answers and picks at random. In return the analysis is as simple as it gets, because the shares divide cleanly into 100 per cent.
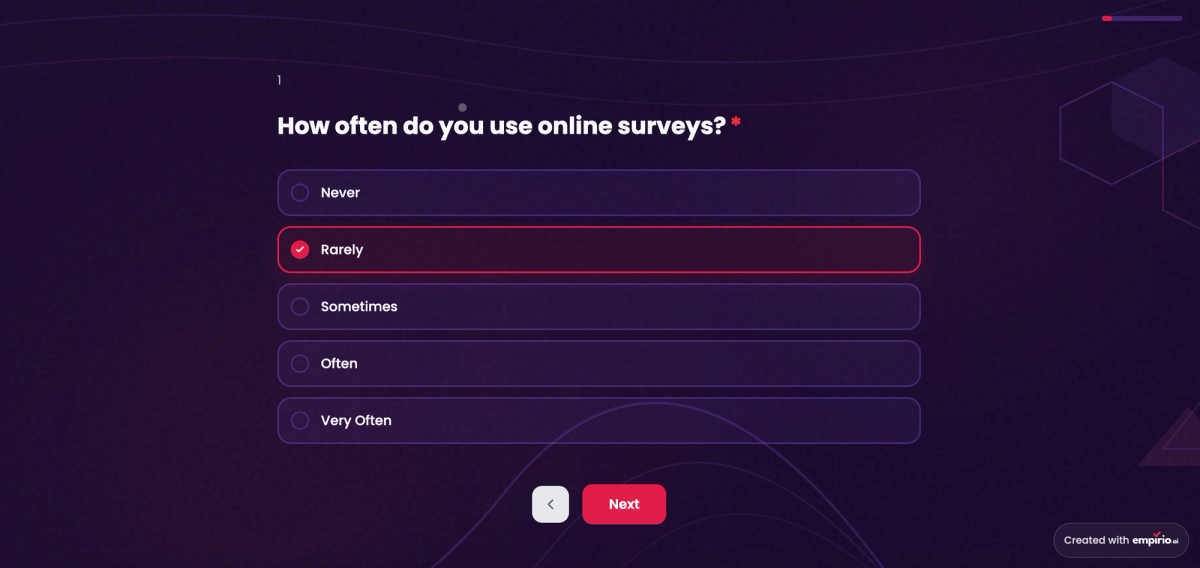
The boundary with related forms and further examples are set out in the article on single-choice questions.
Advantages and disadvantages of closed-ended questions
The biggest advantage of closed-ended questions is fast, objective analysis; the biggest disadvantage is the limit set by whatever someone thought of in advance. The two are the same thing: the very list that makes analysis easy cuts off everything not on it.
What closed-ended questions deliver
- Closed-ended questions cost respondents very little time.
- The answers can be analysed statistically with no preparation.
- Every respondent sees the same categories, which makes answers comparable.
- Misunderstandings are rarer, because the options show what is meant.
- The analysis gives the same result whoever runs it.
What you give up in return
- Answers outside the supplied list are lost entirely.
- Anyone who finds nothing suitable ticks something anyway.
- The wording of the categories can skew the result.
- The respondent’s own choice of words stays invisible.
How strongly the categories work is clear from an experiment by the Pew Research Center in January 2002. Half the sample chose between “domestic policy” and “foreign policy”, and 52 per cent picked domestic policy against 34 per cent for foreign policy. For the other half the second category read “the war on terrorism”, and the ratio reversed to 33 against 52 per cent. The question was identical; only one answer category was drawn more narrowly.
The answer list is not the packaging around the question. It is part of the question.
The counterweight sits in the article on open-ended questions: they capture exactly what a fixed list cuts away, but every single answer costs coding time afterwards.
Building answer options that hold up
Answer options for a closed-ended question have to meet two formal conditions: they must be exhaustive, covering every possible reply, and mutually exclusive, so that each reply falls into exactly one category. The GESIS Survey Guidelines name both as the condition for respondents being able to express their answer at all.
Both conditions sound obvious and go wrong constantly, usually unnoticed until the analysis. Four checks catch the common cases, and they take minutes before the questionnaire goes out.
Every possible answer has to appear on the list
When an obvious category is missing, one of two things happens: the question is skipped, or something gets ticked at random. Both damage the data, the second one invisibly. Where the full set of cases cannot sensibly be listed, add an “other” category, ideally with a small text box beside it.
Two answer categories must not overlap
Numeric bands are the classic failure. With the options “between 6:00 and 6:30” and “between 6:30 and 7:00”, someone who gets up at 6:30 faces two correct answers. The GESIS Survey Guidelines solve it with unambiguous limits: “6:00 to 6:29” and “6:30 to 6:59”. The same applies to age bands and income brackets.
The answer categories have to match the question
A common break appears when the question text asks for something the answer list does not offer. “Were you an active member of a club in the past twelve months?” calls for a yes or no, yet it is often paired with “often, sometimes, rarely, never”. Either rewrite the question as a frequency question, or cut the categories back to yes and no.
Write the options for a reading age of nine
The UK Government Analysis Function, which publishes questionnaire design guidance alongside the Office for National Statistics, points out that the average reading age in the UK is around nine years old. Answer options are where that bites hardest: they are read quickly, out of context and often on a phone. Short options in everyday words are therefore not a simplification, they are a condition for the data being comparable across respondents.
⚠️ Watch out
Test your answer lists against an invented person who fits them badly. Someone with no fixed waking time, who never uses a cash machine or who falls into none of your age bands will expose the gap in seconds.
Create a survey for free
With empirio.ai you can create a modern online survey in minutes — with hosting in the EU.
- AI-built survey
- Adjust by drag & drop
- Real-time analysis
How many answer options make sense?
For rating scales the GESIS Survey Guidelines recommend five to seven points; for plain answer lists the Pew Research Center suggests four, or five at most. The two numbers do not contradict each other, they apply to two different formats.
Both recommendations rest on the same reasoning. Too few categories stop showing differences; too many become unclear, because nobody can say what separates point four from point five. Menold and Bogner (2015) summarise the research as showing that five to seven points perform best on reliability and discrimination, and that respondents themselves prefer that range.
| Format | Recommended number | Source |
|---|---|---|
| Rating scale | 5 to 7 points | GESIS Survey Guidelines |
| Answer list, especially by phone | 4, at most 5 | Pew Research Center |
| Factual question such as qualification | many more are fine | Pew Research Center |
A second point matters almost more than the number itself: label every point, not just the two ends. Fully labelled scales raise reliability and validity according to Menold and Bogner (2015), are preferred by respondents and help people with less formal education in particular. Read how that looks on the best known scale format in the article on the Likert scale.
A middle category on a rating scale: include it or leave it out?
You will often read the advice to use an even number of points so that respondents have to take a side. The research does not really support that. Menold and Bogner (2015) accept that the middle is also picked out of convenience or social desirability. Even so, most researchers recommend offering it, because people who genuinely sit in the middle otherwise shift systematically to a neighbouring category and skew the distribution.
When a “don’t know” category belongs in the question
A “don’t know” category is not a matter of right or wrong but of content, mode and audience. The GESIS Survey Guidelines suggest deciding on exactly those grounds: if you can be sure every respondent has an answer, you can leave it out. For knowledge questions and attitudes on remote topics that is rarely the case, and without the option people tick a substantive category at random.
💡 Tip
Set “don’t know” and “prefer not to say” visibly apart from the rest of the scale, for instance with a blank line. Otherwise the visual midpoint of the scale shifts and respondents anchor on the wrong place.
Common mistakes with closed-ended questions
Most mistakes with closed-ended questions sit in the answer options rather than the question text. Four of them turn up especially often, and all four can be fixed in minutes before the questionnaire goes out.
What these four have in common is that they stay invisible in the data. A skewed distribution looks like a finding rather than a fault, which is exactly why the check belongs beforehand.
Putting everything on an agree-disagree scale
Scales running from “strongly agree” to “strongly disagree” are convenient because they fit any statement. They also encourage acquiescence, the tendency to agree regardless of content. GESIS therefore recommends direct scales that ask about the actual dimension. Instead of the statement “Short waiting times matter to me” on an agreement scale, ask directly: “How important are short waiting times to you?” from “very important” to “not important at all”.
Using “select all that apply” instead of a decision per item
Tick-box lists are the default in online surveys and still the weaker option. The Pew Research Center dropped them altogether after its own 2019 study, because forcing a decision on each item yields more accurate answers, particularly on sensitive topics. GESIS likewise recommends a yes-no format per alternative. A list of eight boxes then becomes eight short yes-no questions.
Ignoring the order of the answer list
Where an answer sits in the list affects how often it is picked, and the direction depends on how the question is delivered. In visible lists, so online and on paper, the top entries are chosen more often: the primacy effect. Read out over the phone, it is the last ones: the recency effect. Both GESIS and Pew describe this pattern. For lists with no internal gradation, randomising the order per respondent helps; for graded scales it does not, because the order carries meaning and stays put.
Assuming a regularity that is not there
Answer categories such as “once a month”, “every two weeks” or “every week” assume the behaviour follows a rhythm at all. Plenty of people take out cash when they need it rather than by the calendar. The GESIS Survey Guidelines therefore recommend asking for a count within a fixed period: “How often did you take money out of a cash machine last month?” with the options not at all, once, two or three times, four times or more.
Analysing closed-ended questions
Closed-ended questions are analysed by counting how often each answer category was chosen and converting the counts into percentages. Which further calculations are valid is decided not by the question format but by the level of measurement of the answer categories.
Clean answer options pay off at exactly this step. Mutually exclusive categories can be counted straight off; overlapping ones cannot. And a category nobody chose is a finding too: it was either unnecessary or unclearly worded.
- Count the frequencies. How often each category was chosen, in absolute numbers and per cent.
- Fix the base. With multiple answers the percentages exceed 100, and that needs stating.
- Report missing values separately. A skipped question and a “don’t know” are not the same thing.
- Compare subgroups. A cross-tabulation shows whether two groups really differ.
At the subgroup stage the level of measurement decides. For nominal categories such as subject of study a mean is meaningless, so you count frequencies. For ordinal categories such as degree classifications the median is the sound figure. Whether a mean may be taken from a rating scale is disputed in the methods literature, because it assumes equal distances between the points. It is reported anyway in many studies, and when it is, a sentence explaining why that is defensible belongs with it. Which level applies to your data is settled in the article on levels of measurement.
Conclusion
Closed-ended questions are not the easy option but the demanding one: all the thinking sits at the front, in the answer categories, and cannot be repaired later. Work exhaustively and exclusively, choose the number of points deliberately and keep an eye on the order, and you get data you can analyse the same day.
Where to go next
- Want to weigh up both question forms? Open and closed questions compared
- Need the other side in detail? Open-ended questions and how to code them
- Looking for further question formats? Question types in a questionnaire
- Building your questionnaire right now? How to create a questionnaire
The full rules on answer categories are in the GESIS Survey Guidelines by Lenzner and Menold (2015), and UK-specific guidance is published by the Government Analysis Function.
Want to try closed-ended questions straight away?
With empirio.ai, an online survey tool from Germany, you can set up single-choice, multiple-choice and scale questions in a few clicks and see the frequencies directly in the results. Create a survey for free