

Every patient who leaves a Denver dental practice gets a text about an hour later with a single question. In March, the practice’s two offices both come in at 78 percent, and the owner is about to shrug it off as a tie. Then she checks who tapped a 1. At the Highlands office that list is short. At Cherry Creek it runs long, and almost every comment in it is about a bill nobody saw coming.
The Customer Satisfaction Score is a metric that measures how satisfied customers are with one particular experience, like buying something, getting a package or talking to support: shortly afterward you ask people to rate their satisfaction from 1 (very dissatisfied) to 5 (very satisfied), then report the 4s and 5s as a percentage of every answer you got. Read on and you’ll be able to phrase the question, do the math by hand and notice when a healthy-looking percentage is papering over trouble.
📌 Key takeaways
- The CSAT scores a single experience from 1 to 5.
- A 4 or a 5 is what counts as satisfied.
- CSAT = satisfied responses ÷ all responses × 100.
- Results range from 0 to 100 percent.
- Ask it shortly after a purchase, an appointment or a support call.
Create a survey for free
With empirio.ai you can create a modern online survey in minutes — free to start.
- AI-built survey
- Adjust by drag & drop
- Real-time analysis
What is the CSAT?
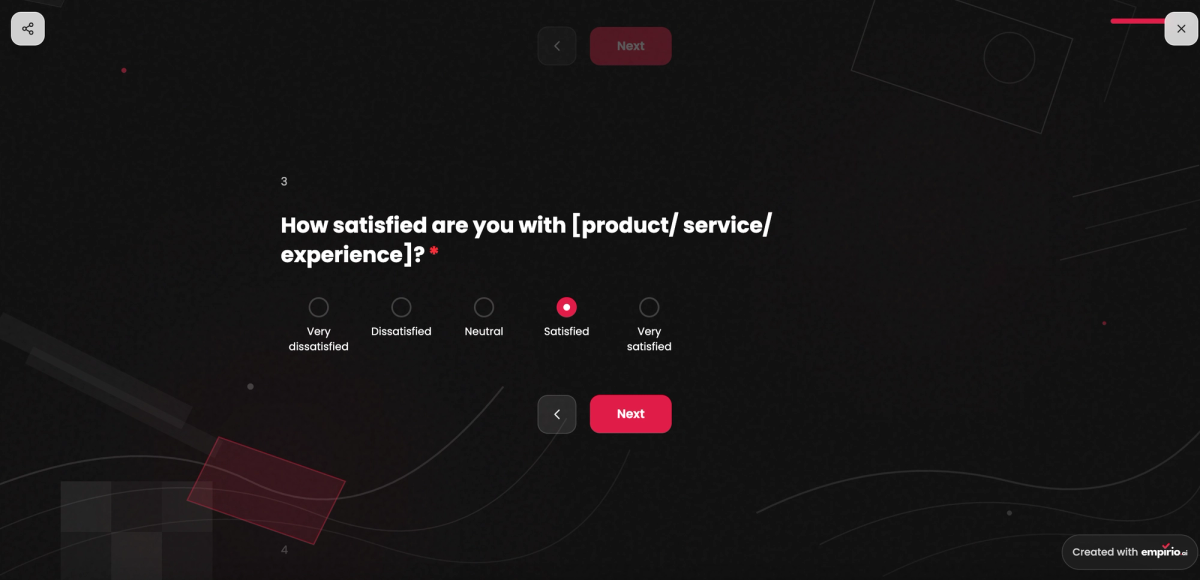
The Customer Satisfaction Score, usually shortened to CSAT, is the go-to satisfaction metric for one touchpoint, and it runs on one question:
“Overall, how satisfied are you with our service?”
The answer options go from 1 (very dissatisfied) to 5 (very satisfied). Unlike the 0 to 10 NPS scale, each of the five options wears its own label, from “very dissatisfied” through “neutral” up to “very satisfied.”
Nobody can claim to have invented the CSAT, and no landmark paper stands behind it. Asking customers whether they were satisfied is as old as customer research, so the wording varies from company to company. Just how standard it became shows up in a Corporate Executive Board study (the firm is now part of Gartner) that appeared in the Harvard Business Review in 2010: around 80 percent of the customer service organizations it looked at used the CSAT as their main yardstick.
The appeal is timing. Instead of asking what patients think of the practice overall, a CSAT question asks about this morning’s cleaning, last night’s delivery or the support chat that just ended. For a team trying to repair one step in a process, that’s ideal, because the next batch of answers shows whether the repair landed.
The difference between “satisfied” and “loyal”
Happy today doesn’t mean here next year. That same study found that 20 percent of customers who described themselves as satisfied were planning to leave anyway, and 28 percent of the dissatisfied ones intended to stay put. Treat your CSAT as a reading of the mood after one experience. How firmly customers are tied to you is a separate question.
Satisfied, neutral, dissatisfied: how the five points are grouped
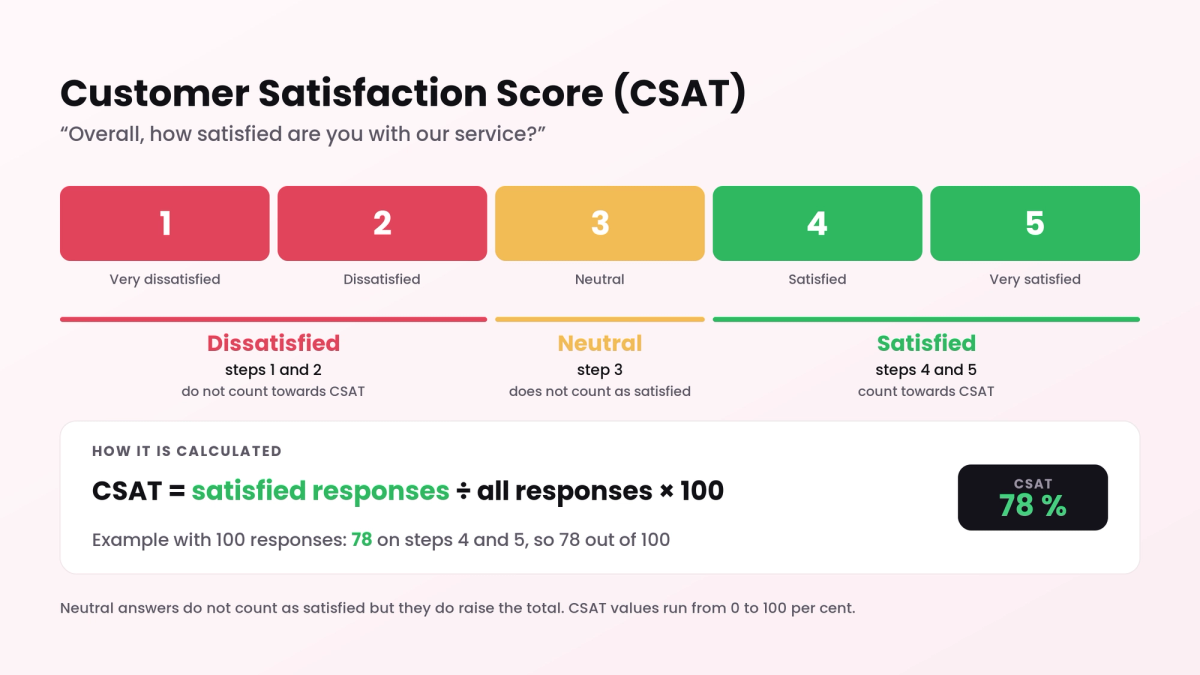
At analysis time, the five answer options get sorted into three buckets:
- Satisfied (4 and 5): these two are all the CSAT counts.
- Neutral (3): left out of the satisfied count but kept in the total, which drags the percentage down.
- Dissatisfied (1 and 2): the responses to chase up while the visit is still fresh.
Researchers call this approach top-2 box: of the five boxes on the form, only the top two score. A 3 earns nothing, by design. Patients who pick it typically had no complaint, but they didn’t leave impressed either, and a practice that lives on referrals needs more than “it was okay.”
You’ll also run into seven-point versions, rows of smiley faces and star ratings. Any of them works if you settle beforehand which answers count as satisfied and then leave that cutoff alone. Under the hood, every one of these formats is a rating scale whose points carry labels.
Tip
A satisfaction score leaves out how hard someone had to work to get helped. Measuring that is the job of the Customer Effort Score. Pair the two after support contacts: a patient who was greeted warmly but needed three phone calls to move an appointment might hand the visit a 4 and still call the rescheduling a hassle.
How to calculate the CSAT: formula and worked example
To calculate the CSAT, divide the count of satisfied responses (4s and 5s) by the count of all responses, then multiply by 100. That gives you a percentage somewhere from 0 to 100.
- Tally each answer option. Note how many 5s, 4s, 3s, 2s and 1s came in.
- Combine the top two. Add the 4s and the 5s together.
- Convert to a percentage. Divide by the grand total and multiply by 100.
Plug your tallies into our tool to calculate the CSAT and get the mean rating as a bonus.
The Customer Satisfaction Score formula
CSAT = satisfied responses (4 and 5) ÷ all responses × 100
Here are the 100 March replies from the Highlands office:
| Rating | Responses | Counts as satisfied |
|---|---|---|
| 5 very satisfied | 52 | yes |
| 4 satisfied | 26 | yes |
| 3 neutral | 8 | no |
| 2 dissatisfied | 9 | no |
| 1 very dissatisfied | 5 | no |
| Total | 100 | 78 satisfied |
Add 52 and 26 and you have 78 satisfied patients. Divide 78 by 100, multiply by 100, and the CSAT is 78 percent. Averaged across all five options, the rating is 4.11.
Cherry Creek reaches the same 78 percent by another path: 25 fives, 53 fours, zero threes or twos, and 22 ones. Its average sinks to 3.59. At Cherry Creek, more than one patient in five was very dissatisfied, while at Highlands it was one in twenty. So check the row of 1s every time, not just the headline number.
Tip
Give each touchpoint its own CSAT: scheduling, the chair, the front desk, the bill. Lumped together, they hide the one place that hurts. A 94 percent for the appointment and a 63 percent for billing produce a combined number that calms everyone down and fixes nothing.
What is a good CSAT score?
There’s no one percentage that counts as a good CSAT everywhere. Customers grade a checkout more kindly than a complaint call, and they hold a dentist to a different bar than a delivery driver. For a rough orientation, our CSAT calculator sorts scores like this, as a reading aid rather than a norm:
- 85 to 100 percent: very good. Almost every customer at this touchpoint is happy.
- 75 to 84 percent: good. Most are happy, and the top still has space.
- 60 to 74 percent: room to improve. About every third or fourth customer isn’t won over.
- 0 to 59 percent: critical. This touchpoint has a basic problem.
Expect high numbers, since many people choose “satisfied” just to be nice. That makes a five point slide meaningful. What really counts is the line over time for one touchpoint: three straight months of lower billing scores signal a change, whether or not the number has left the good band yet.
The wider economy leaves marks too. According to the American Customer Satisfaction Index, national satisfaction in the US fell sharply in the second quarter of 2026, with complaints at a record high (ACSI, August 2026). A dip in your own CSAT during a stretch like that calls for checking each touchpoint against its past before anyone gets blamed.
Careful
The American Customer Satisfaction Index (ACSI) is a different animal. University of Michigan researchers started it in 1994, it is scored from 0 to 100, and by the ACSI’s own account each score combines three survey questions weighted by a statistical model. So when the ACSI Finance Study 2026 gives US banks an 80, no bank has earned a CSAT of 80 percent. Keep your CSAT comparisons in house, against your own earlier rounds.
Create a survey for free
With empirio.ai you can create a modern online survey in minutes — free to start.
- AI-built survey
- Adjust by drag & drop
- Real-time analysis
How to ask the CSAT question in your survey
Nothing affects a CSAT as much as when you send it. Ask as close to the experience as you can: at the register, a few hours after the package shows up, the moment a ticket is closed. The Denver practice texts within the hour rather than with next month’s statement, because by next week the cleaning has blurred together with the parking, the bill and everything since.
Precise wording pays off. “How satisfied are you with today’s cleaning?” gets you further than “How satisfied are you with us?” When several stages matter, give each stage its own satisfaction question, just as our customer satisfaction (CSAT) template does. Our guide on how to create a questionnaire helps you line those questions up in a logical order.
Before you send the CSAT question
- The wording names the exact experience you want rated.
- Each of the five options has a written label.
- Satisfied sits on the same side in every survey.
- Customers get the question within hours, not days.
- The cutoff (4 and 5 count) is documented.
- A 1 or a 2 opens a follow-up asking why.
Tip
Set up skip logic so a 1 or a 2 opens an open-ended question such as “What should we have done differently?” There’s no need to quiz the happy patients. The unhappy ones are where the explanations live, and everyone else finishes in ten seconds flat.
Pros and cons of the CSAT
For most teams the CSAT is the first customer metric they try, since it explains itself. That simplicity wins arguments in meetings, and it also invites misreadings.
Why teams reach for the CSAT
- The percentage is self-explanatory for any audience.
- It plugs into any single touchpoint and flags the weak one.
- One tap to answer means more people respond.
- Answers arrive the same day, so your team can act fast.
- It fits a store, a website, a class or a trade show booth.
Where the CSAT lets you down
- Satisfied customers can still walk out for good.
- Politeness inflates the numbers.
- It rates a moment, never the full relationship.
- Scales and cutoffs differ by company, so outside numbers mislead.
- Counting only 4s and 5s treats a 1 and a 3 alike.
What the CSAT can’t tell you
Think of the CSAT as a photo taken from one spot. Draw conclusions it can’t support and you’ll repair the wrong things, or reward the wrong people.
Three blind spots are worth knowing before the number turns into a quarterly target or part of anyone’s bonus.
CSAT and loyalty barely move together
Research published in the Harvard Business Review turned up only a loose connection between how satisfied customers said they were and how loyal they turned out to be. A perfectly happy customer will still switch for a lower price, a shorter drive or a shiny new option. If you want to know who stays and who refers friends, other metrics handle that job better.
The CSAT misses everyone who dropped out early
A CSAT question only reaches people who got as far as the step you’re rating. Somebody who abandoned online booking halfway, or who never returned after a first appointment, won’t ever see it. That’s why a strong CSAT can simply mean the unhappy customers already left, and their opinions left with them.
CSAT numbers from other companies don’t line up with yours
Company A counts 4 and 5 on a five-point scale. Company B counts 6 and 7 out of seven. Company C only counts perfect scores. Each of them publishes a “CSAT.” Borrowed figures give you a vague hint at most, never a benchmark you can trust.
A CSAT captures how one moment felt. It can’t promise the customer will be back.
How the CSAT differs from other metrics
Three metrics dominate customer surveys, and each points at a different piece of the experience:
- The CSAT rates how satisfied someone was with one specific experience, so it zooms in on a single moment.
- The CES (Customer Effort Score) rates how easy it was to get something taken care of, so it looks at the steps along the way.
- The NPS (Net Promoter Score) asks whether someone would recommend you, so it sizes up the relationship as a whole.
Our NPS, CSAT and CES comparison walks through when each number fits and how to combine them.
Common mistakes in CSAT surveys
Setting up a CSAT survey is quick, and so is skewing it. The trouble usually comes from when the question goes out and who receives it, not from the arithmetic.
Our 8 tips for the perfect online survey cover the ground rules for any questionnaire. For the CSAT specifically, these three mistakes show up constantly.
Sending the CSAT question late or keeping it vague
Ask two weeks after a purchase and you’re no longer measuring the purchase. You’re measuring the shipping emails, the first week of use and whatever else happened in between. A bare “How satisfied are you with us?” has the same problem. Tell people which experience you mean, and ask while they still remember it.
Surveying only the tickets marked solved
Some help desk tools trigger the CSAT survey only after a ticket is flagged as solved. Customers whose problem never got fixed are simply skipped. The score goes up, the service doesn’t. Trigger the survey after every closed contact, the messy ones included, so dissatisfied customers get heard as well.
Changing the CSAT counting rule along the way
Someone swaps the five points for smileys, switches from top-2 to top-1, or drops the neutral option. Every one of those moves shifts the score, while customers feel no different. Lock in your scale and your cutoff and document both, and your successor will still be comparing like with like.
Conclusion
No metric asks “how did that go?” more directly than the CSAT. It takes seconds to answer, minutes to calculate and no explanation at all. Just don’t ask more of it than it can give, because it captures a moment and not a relationship. Name the experience and ask promptly, count only 4s and 5s, ask for reasons whenever someone picks 1 or 2, and score every touchpoint separately. That way the CSAT points you to the exact spot that needs work!
Where to go next
- Getting ready to survey your whole customer base? Customer surveys: guide and examples
- Results are in and you want to dig deeper? How to evaluate a questionnaire in five steps
Ready to track the CSAT across your touchpoints?
empirio.ai, an online survey tool from Germany, lets you set up a customer survey in minutes and send it out as a link or a QR code. Our CSAT template comes with a satisfaction question for every stage of the customer experience.