

Close a support chat and a box pops up: “How would you rate this conversation?”, with five stars underneath. Hardly anyone stops to ask what that row of stars is called. The name is rating scale.
A rating scale is a graded set of answer options on which a respondent marks how strongly a characteristic applies to them, usually five to seven steps between two labeled endpoints, with each step standing for one degree of a subjective judgment rather than a measured quantity. By the end of this article you will know how many steps your scale needs, how to word them and which figure you are allowed to report.
📌 Key points at a glance
- A rating scale records degrees, not yes-or-no answers.
- Five to seven steps is the common recommendation.
- Strictly speaking, a rating scale measures at the ordinal level.
- Label every step with a word, not just the ends.
- “Don’t know” belongs outside the scale, never in the middle.
Create a survey for free
With empirio.ai you can create a modern online survey in minutes — free to start.
- AI-built survey
- Adjust by drag & drop
- Real-time analysis
What is a rating scale?
A rating scale is a closed answer format with several graded categories on which a respondent judges how strongly something applies, for example from “not at all satisfied” to “extremely satisfied”. The word rating means judgment or appraisal, which is why the format also travels as response scale, assessment scale or evaluation scale.
The GESIS Survey Guidelines call it “a continuum (e.g., agreement, intensity, frequency, satisfaction) with the help of which different characteristics and phenomena can be measured in questionnaires” (Menold and Bogner 2016). Value comes from the gradation: a yes-or-no question sorts people into two camps, while a rating scale shows how far each person sits between the poles. Among the question types in a questionnaire, that makes it the default for attitudes and satisfaction.
Rating scales turn up in two roles. Self-rating asks people to judge themselves, say how confident they feel speaking up in a seminar. Other-rating asks somebody else to judge them, say a supervisor rating an intern’s reliability. Both look identical on the page, and their error sources are not alike.
A rating scale does not record how something is. A rating scale records how something feels to the person answering.
One more boundary, because search results mix the two. In finance, a rating scale means the letter grades agencies and banks use to sort credit risk. Our subject is only the rating scale as an answer format in an online survey or on paper.
What level of measurement does a rating scale have?
A rating scale measures at the ordinal level, strictly speaking. Steps come in a clear order, but nothing proves that the distance from “rarely” to “sometimes” matches the distance from “often” to “always”.
Even the design guidelines concede the point. The GESIS Survey Guidelines list what a verbalized scale should achieve, and the last item asks only that “the rating scale categories should suggest apparently equidistant ranges between the categories”. Suggest and apparently are doing a lot of work there. Equal spacing is a goal a good scale approximates, not a property you can prove.
Where a rating scale and a Likert scale part ways
A Likert scale is one particular build of rating scale, not an alternative to it. Its markers are an agreement continuum, several items about one construct and a combined score. A single question of that kind is more correctly a Likert-type item, and it stays ordinal. The rest is in our guide to the Likert scale.
A summed score across several items, by contrast, is usually analyzed as though it were an interval scale. Adding numbers up does not raise the level of measurement. The practical argument runs differently: such a score has many gradations, and the common procedures have proven robust against this violation. An assumption is all it is.
For your methods section
Anyone averaging response steps owes the reader one sentence: “Response categories were treated as equidistant.” That line costs a single row and answers the question your committee was going to ask. Without it, the analysis quietly claims a level of measurement the data cannot support.
What types of rating scales are there?
Rating scales differ in more than length. Three questions describe every scale in a questionnaire: which direction it runs, how its steps are marked and how finely somebody can answer.
How you settle them decides much of your data quality. A scale with two poles and only its ends in words asks something different of people than a five-step scale where every box has a word.
Unipolar or bipolar: how many directions the scale covers
A warning belongs ahead of the examples. The GESIS Survey Guidelines note that “there is, however, no uniform definition of scale polarity in the literature”, so anyone using the terms in a thesis should say which one they follow. GESIS offers a usable one: bipolar scales “comprise two opposite continua”, unipolar scales run “from a low to a high level”.
A unipolar rating scale captures the intensity of one characteristic. “How useful were the instructor’s office hours?” runs from not at all useful up to extremely useful, and nothing sits opposite usefulness. A bipolar scale puts two opposites at the ends. “The pace of this course was …” runs from far too slow through about right to far too fast, and its middle means something: about right is the best answer on offer, not a neutral one.
Words, numbers or pictures: how the steps are marked
Marks are what respondents actually see, and each kind has its home turf. Words carry meaning on their own. Numbers borrow theirs from a system the respondent already knows. Symbols travel fast but coarsely, while a graphic line trades clarity for precision.
| Type of mark | What respondents see | Where it works |
|---|---|---|
| Verbal | one word per step | the default, hardest to misread |
| Numerical | numbers, say 0 to 10 | familiar systems, longer scales |
| Symbolic | stars, smileys, thumbs | children, quick one-off feedback |
| Graphic | a point on a line | fine gradations, online only |
Numbers look unambiguous and frequently are not. Letter grades are the example every reader here grew up with. The registrar at the University of North Carolina at Chapel Hill states the set plainly: “Letter grades of A, B, C, D, and F are used” (UNC-Chapel Hill). Four passing letters, one failing letter, no E.
Grade points then map the letters onto the 4.0 scale, A at 4.0 down to F at 0.0, while B+ sits at 3.3 and C- at 1.7. Neighboring letters are a full point apart, a letter and its plus 0.3 apart, and one letter is skipped. Hardly anybody notices, which is the lesson: familiar does not mean evenly spaced.
Numeric marks are not doomed, though. The Net Promoter Score runs from 0 to 10 with words only at the ends, and it goes back to an article Fred Reichheld built around one survey question in the December 2003 Harvard Business Review: “Would you recommend this company to a friend?” (Reichheld 2003).
Fixed steps or a continuum: how fine the answer can be
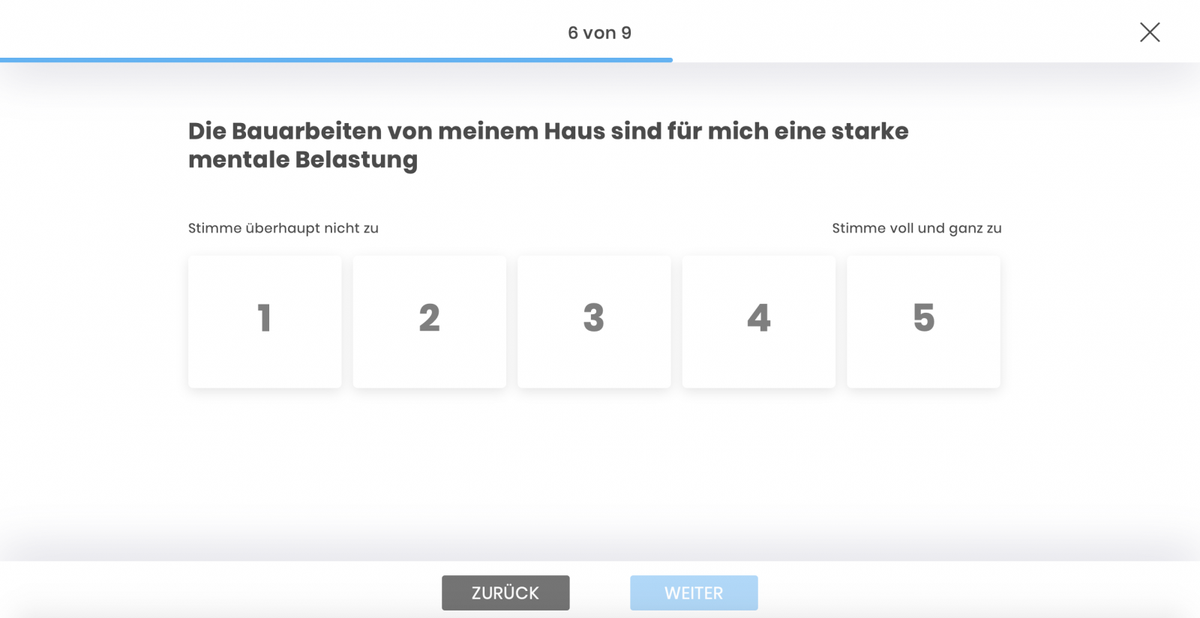
Most rating scales are discrete: a fixed number of boxes, nothing in between, on paper as much as on screen. Continuous scales swap the boxes for a slider on which any point can be picked, the same idea medicine uses in the visual analog scale for pain. Online that works well, on paper somebody would need a ruler.
How many steps should a rating scale have?
Five to seven steps is the common recommendation. Reviewing the research, the GESIS Survey Guidelines report that optimal measurement “could be achieved with five to seven categories” and that “respondents also preferred scales of this length”.
The matter is not settled, though. The same guideline points to studies that found a linear relationship between the number of categories and measurement quality, with the maximum tested ranging “between 10, 11, and 100”. What keeps the rule of thumb alive is practical: five to seven points are “easier to verbally label”.
For your own questionnaire that becomes a short rule. Stay at five if every step is to get a word, go to seven when you need finer distinctions, and treat anything longer as a scale you must leave half unlabeled.
Odd or even: the question of the middle
An odd number of steps has a middle, an even number forces a decision. Both are defensible, and the choice hangs on whether a middle position exists in the subject matter. “How satisfied are you with the study spaces on campus?” has real middle ground. “Would you sign up for this workshop again?” does not.
The GESIS Survey Guidelines summarize the research this way: “most researchers recommend that a middle alternative should be offered in order to prevent respondents who have a moderate or neutral opinion from having to use an alternative category, thereby systematically distorting the data”. Convenience is not the argument, data quality is. Drop the middle and people who truly sit there drift to a neighbor, tilting your distribution in a direction nobody holds.
Bipolar scales come with one extra wrinkle. Their middle can mean indifference, neither one nor the other, or ambivalence, a bit of both. Nothing in the answer tells the two apart, so either add a separate category off to the side or name the ambiguity when you interpret. Unipolar scales are easier: their middle simply marks a middling amount.
Keep the opt-out off the scale
“Don’t know” and “no answer” are not steps and do not belong in the middle. Set them off at the end of the list and count them as missing values. The General Social Survey does exactly that, coding “Do not Know/Cannot Choose” separately from its three happiness categories (GSS Data Explorer, NORC). Whether to offer the option depends, per GESIS, on “question content, survey mode, and target group”. Leave it out and some people use the middle box instead, which Sturgis and colleagues call “face-saving don’t knows”.
Create a survey for free
With empirio.ai you can create a modern online survey in minutes — free to start.
- AI-built survey
- Adjust by drag & drop
- Real-time analysis
Labeling the steps of a rating scale
Give every step a word, not just the two ends. Reviews collected in the GESIS Survey Guidelines find that fully verbalized scales raise reliability and validity, that respondents prefer them, and that “people with low and moderate formal education especially benefit from full verbalisation”.
Good step words meet a short list of conditions. According to the same guideline, “the verbal labels should be precise”, “the rating scales should be balanced”, meaning equal numbers of positive and negative steps, and the labels should be “generally comprehensible, or universal”. On top of that they should read as evenly spaced.
Why word lists do not survive translation
Calibrated step words belong to the language they were tested in. The GESIS review notes that most studies developing universally applicable verbal labels “were conducted in the English-speaking area”, while Rohrmann (1978) “proposed German-language verbal labels for various continua”. Steps tuned for German readers stop being evenly spaced once somebody translates them, so borrow from a survey written in your own language.
For American English there is plenty to borrow from. National surveys have tested their wordings across decades and publish them openly, which beats labels invented on the spot:
- Happiness, from the General Social Survey, asked in all 35 rounds since 1972: very happy, pretty happy, not too happy (GSS Data Explorer, NORC).
- Favorability, listed by Pew Research Center as ordinal response categories: very favorable, mostly favorable, mostly unfavorable, very unfavorable (Pew Research Center, Writing Survey Questions).
- Agreement, as used in the International Social Survey Programme: strongly agree, agree, neither agree nor disagree, disagree, strongly disagree.
Notice what those sets have in common. None of them is a ladder of adverbs bolted onto one adjective. Each was written for its own subject, which is what makes the steps read naturally.
Test the words, not just the question
Read your finished scale to five people from your target group and ask what separates step two from step three. When they hesitate or invent their own wording, the gap is real and your respondents will paper over it silently. Ten minutes of that beats any word list.
How to analyze a rating scale
Report the frequency distribution first, meaning how many people picked each step. Reporting it is allowed at every level of measurement, and it shows what summary figures hide.
Take a six-point scale and 50 students rating the new 8 a.m. lab section. Twenty-five pick step 1, the other twenty-five step 6. Their mean comes out at 3.5, a value nobody chose and a step the scale does not even have. The median lands there too, so it rescues nothing. Only the distribution shows what happened: two camps, no middle ground.
| Statistic | What it needs | Typical use |
|---|---|---|
| Frequency distribution | nothing beyond an order | always, as the base report |
| Mode | nothing beyond categories | naming the most popular step |
| Median | an order of steps | a single item |
| Mean | assumed equal spacing | a scale score across items |
| Standard deviation | assumed equal spacing | spread around a scale score |
| Top-two box | an order of steps | reports and presentations |
Nothing here forbids the mean, but the mean needs a reason. On a single item the median is safer, since an order of steps is all it assumes. On a scale score from several items the mean is customary, as long as your methods section names equidistance as an assumption.
Comparing groups without overreaching
The same split governs comparisons. Single items go to rank-based procedures, which work off positions rather than distances. Scale scores may also go to procedures built on means and spread. Where the line between summarizing data and generalizing beyond it runs is covered in our guide to descriptive and inferential statistics.
Top-two box: handy on a slide, costly in the data
Practitioner reports lean on the top-two box everywhere. Combining the two most positive steps into one percentage gives you a sentence like “64 percent are satisfied or very satisfied”, easy to say and to remember. Perfectly legitimate, and it throws away most of what you collected. Anybody quoting a top-two box puts the full distribution in the appendix.
Common mistakes with rating scales
Most weaknesses in a rating scale are built in while wording it, not while computing with it. Response bias is the survey term for answers that drift in a fixed direction regardless of the question. Not everybody is affected, and among those who are the drift goes one way, which is why a bigger sample does not cancel it out.
The four patterns below are summarized in the GESIS Survey Guidelines on response biases (Bogner and Landrock 2016). A larger sample helps against none of them, a better questionnaire against all four.
Moderacy bias pulls answers toward the middle
Some people pick the middle steps whatever the question says, because deciding costs effort. GESIS defines the pattern as choosing a middle category “irrespective of question content and of whether the category actually represents the respondent’s true attitude”. Your distribution then looks more balanced than the opinions behind it. Full verbal labels help: every step gains a meaning.
Acquiescence makes people agree with anything
Acquiescent respondents “agree to statements irrespective of their content”, as GESIS puts it, selecting “agree”, “true” or “yes” wherever those appear. One countermeasure works, and the guideline names it bluntly: distortion through acquiescence “can be prevented only by avoiding question formats such as ‘agree-disagree,’ ‘true-false,’ and ‘yes-no’”. Asking directly about frequency or importance sidesteps it.
Social desirability cleans up the awkward questions
On sensitive topics, answers slide toward what seems expected rather than what is true. Norm-breaking behavior gets played down, norm-abiding behavior played up. Good news for web surveys: where social distance is large, “as in the case of a self-administered web survey”, GESIS reports a weaker tendency to present oneself favorably. Weaker is not gone.
Extreme responding is not only about the topic
Extreme response bias is the mirror image of moderacy bias, the habit of reaching for the outermost steps whatever the content. Measuring it means counting extreme picks across a series of scales. Whether a stable personal trait sits behind it remains open, and GESIS reports “no uniform findings” there. The mode effect is documented, though: phone and face-to-face interviews are more prone to it than web surveys.
One last mistake is purely visual. Steps must sit at equal distances on the page, or the conceptual middle of the scale and the middle a respondent sees land in different boxes. More levers are in our tips for online surveys.
Conclusion
A rating scale takes two minutes to add to a questionnaire and about the same to ruin. Five fully labeled steps, a deliberate decision about the middle and an equally deliberate one about the opt-out buy more data quality than another hundred respondents will. The analysis rule is short: the distribution always goes in the report, the mean only with a reason.
Where to go next
- Want the whole picture of measurement levels? Levels of measurement
- Working with agreement items? Likert scale
- Still picking an answer format? Question types in a questionnaire
- Surveying your own team? Employee satisfaction surveys
Want to try your scale before it goes out?
With empirio.ai, an online survey tool from Germany, you can build a graded scale in minutes and see after a handful of test responses whether the distribution supports what you plan to report.