

Picture two questions from the same customer survey. The first asks “Would you recommend us to a friend?” and allows nothing but Yes or No. The second asks “What could we do better?” and offers an empty text box.
From the first you get a tidy split, perhaps 82% Yes and 18% No, which you can show as a chart straight away and break down further with a cross tabulation. From the second you get 140 answers worded in 140 different ways: one person writes a sentence, another a whole paragraph, a third simply “fine really”. That contrast shows quite quickly why free text needs a plan of its own. Counting alone won't get you very far here, and yet this is exactly the spot where you learn why your figures look the way they do.
The best way to analyse free-text questions, or open-ended questions as they're often called, is to decide first how closely you want to look. A small number of answers you read from start to finish, whereas a large number you group into categories and count how often each one comes up. Most reliable of all is a mix of the two, where you build categories and still read every original answer once.
We'll show you how to find the right depth and how to report a result that other people can rely on. With empirio.ai you read free text in the response list, view it as a word cloud and let the AI summarise it or sort it into themes.
📌 The key points at a glance
- Read a handful of answers in full, sort large numbers into categories.
- A word cloud shows frequent terms, but not what they mean.
- With AI, even hundreds of free-text answers become far easier to analyse.
- empirio.ai offers you various tools for analysing free-text answers.
- The AI on empirio.ai summarises responses and sorts them into themes.
Create a survey for free
With empirio.ai you can create a modern online survey in minutes — with hosting in the EU.
- AI-built survey
- Adjust by drag & drop
- Real-time analysis
What makes open-ended questions different to analyse
Staff at a district council give their workplace 3.1 out of 5 on average in the annual staff survey. You now have a number, but no explanation. Follow it with “What is the main reason for your rating?” and the picture fills in: “Nobody ever gets back to me about my projects”, or “The kettle on the second floor has been broken for weeks”. Reasons, examples and ideas like these are what open-ended questions are for, since they leave the answer entirely to the respondent, in their own words.
Setting one up on empirio.ai works like any other question in the editor. Short text gives respondents a single line, while Long text offers a larger box for several lines. You can also add an “Other” field to a choice question, creating a semi-open question whose typed entries feed into your analysis alongside everything else.
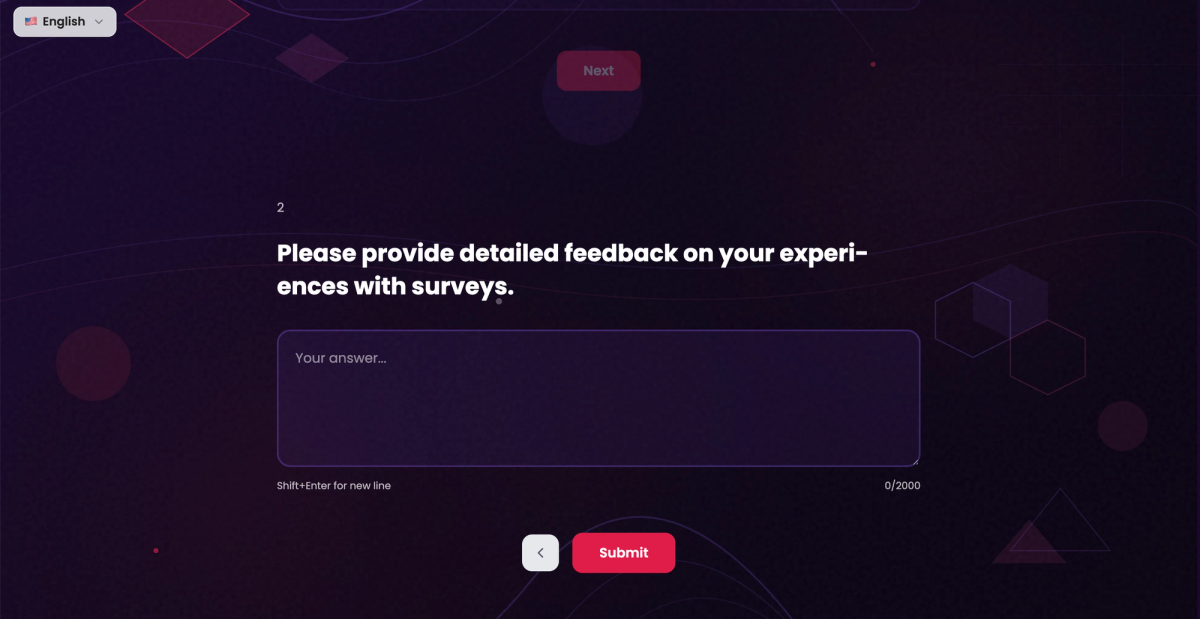
Valuable as open-ended questions are, they come with two drawbacks that are worth knowing about while you're still putting your survey together. Both have a direct effect on your analysis later on.
Drawback 1: Too many open-ended questions cost you responses
Five empty text boxes in a row are a test of anyone's patience. The first might still get two sentences, the third gets “fine”, the fourth nothing, and before the fifth the tab is closed. Since typing is harder work than clicking, people are more likely to give up when a survey has lots of text fields. The GESIS Survey Guideline on open-ended questions by Cornelia Züll notes that, particularly with knowledge questions, open formats draw more “don't know” answers or refusals than closed ones, and it advises using them sparingly so that respondents aren't overburdened. For you, that means: only ask an open-ended question where you genuinely need a reason, for example directly after an important rating question.
Drawback 2: Dissatisfied people write more than satisfied ones
A patient kept waiting for 40 minutes at the GP surgery writes three paragraphs, whereas one seen on time writes “all good” or nothing whatsoever. The same guideline describes this effect, drawn from employee surveys: dissatisfied respondents are more likely to answer at all and tend to give longer answers. Your free text therefore doesn't automatically reflect how everyone feels, and quite often it mainly captures the people who wanted to get something off their chest. For you, that means: when you analyse, count how many people raise a topic rather than letting the length of individual answers steer you.
Analysing open-ended questions: how closely do you want to look?
Fiona manages a repairs team of 50 at a housing association and asked them a single free-text question. She ends up with 50 answers, which she can work through calmly in an afternoon. Callum runs a small online garden supplies business, sent a customer survey with three free-text questions to 800 customers and is now sitting in front of up to 2,400 answers. Both want to find out the same thing, namely what people really think, yet they need completely different routes to get there.
How you analyse free text therefore comes down mainly to three questions:
- How many answers are there? Multiply the number of free-text questions by the number of participants. With 50 participants and three free-text questions you'll have 150 answers at most, while 800 participants take you up to 2,400.
- Do you need to know every answer, or will an overview do? In a small employee survey you may want to respond to each comment individually, so you simply read the lot, either on empirio.ai or in a spreadsheet after exporting. If what you need is a sentence like “Most people especially value our company culture”, you group the answers into categories and count them.
- What did you ask for? Ideas for the summer barbecue are analysed differently from the reasons given in your dissertation. Academic work needs a documented coding frame, whereas a carefully read list is often enough for team feedback.
The methods for analysing open-ended responses
Before you settle on a tool, it helps to look at the methods behind it. There are essentially five ways of handling open-ended answers, and they combine well with one another:
- Reading everything: You read every answer and note down what stands out. Nothing is more precise, although it only works for manageable amounts.
- Coding: You assign each answer to a category such as “price”, “service” or “delivery” and count at the end how often each category appears. Fixing the categories in advance is known as deductive coding, while developing them from the answers as you read is inductive coding. Coding is the classic technique of qualitative research.
- Counting words: Instead of whole statements you count individual terms. A word cloud or a list of the most frequent terms quickly shows which topics come up, but not how they're meant.
- Capturing sentiment: You classify each answer as broadly positive, neutral or negative, which specialists call sentiment analysis.
- Summarising: You boil many answers down to a few key statements. That used to be entirely manual work, whereas today an AI often takes it on and you check its result against the originals.
AI can lend a hand with coding as well. The method stays the same, it's only the sorting that gets much quicker. The Office for National Statistics took a similar line for Census 2021, where write-in answers were matched automatically against predefined indexes of terms, expert coders reviewed whatever the software couldn't place and a 1% sample of coded records was checked for quality.
Which method suits your situation
The table shows which method is right for you, and the column on the right tells you how to put it into practice with empirio.ai. Treat it as a rough guide, though, not as a set of fixed rules:
| Your situation | Suitable method | How it works with empirio.ai |
|---|---|---|
| Few answers, each one should be read | Reading everything | Response list, or the Responses tab in Text Analysis |
| First impression of which topics come up | Counting words | Word cloud under Charts or in Text Analysis |
| Lots of answers, overview within minutes | Summarising | AI Analysis, followed by reading a sample |
| Knowing whether praise or criticism dominates | Capturing sentiment | AI Analysis with the Sentiment analysis focus |
| Result has to be reported in figures | Coding, automatic or by hand | Text Labelling or your own categories in Excel |
| Free text in relation to other questions | Summarising, linked to other questions | AI Assistant or Filter by answer |
| Dissertation with a methods chapter | Coding with a fixed coding frame | Export the raw data and code by hand |
Why you should still read everything once
Suppose your categories show “Price: 40 mentions”. Only when you read the answers do you notice that half of them praise the price and the other half complain about it. Categories smooth over differences like that, while the original answers keep them. So build categories or let the tool suggest them, but also scroll through every answer once, as long as the numbers allow it. That way you get the figures for your report and still keep sight of what people actually wrote.
Analysing open-ended questions with empirio.ai: every feature at a glance
Fiona can get by with the response list for her 50 answers, while Callum, facing 2,400, will be glad of the AI. empirio.ai therefore gives you several instruments for free text, whichever way you like to work, and all of them live in the Results area of your survey:
- Response list: every free-text answer, readable and filterable
- Export: raw data for Excel or as a CSV file
- Word cloud alongside the charts
- Text Analysis: top words, AI Analysis and every answer to one question
- Text Labelling: automatic sorting into themes
- AI Assistant: questions about the whole survey
No AI is involved in the response list, the export or the word cloud. Text Analysis, Text Labelling and the AI Assistant hand part of the job over to the AI. Here are the plans at a glance:
| Feature | Where to find it | Plan |
|---|---|---|
| Response list with filters | Results, Responses | all plans, the free one included |
| Raw data export | Results, Responses, Export | Lite and above, €19 a month |
| Word cloud | Results, Charts | all plans, the free one included |
| Text Analysis | Results, Analysis, Text Analysis | free to try, then from Plus at €39 a month |
| AI Analysis | Results, Analysis, Text Analysis | free to try, then from Plus at €39 a month |
| Text Labelling | Results, Analysis, Text Labelling | free to try, then from Plus at €39 a month |
| AI Assistant | Results, AI Assistant | free to try, then from Plus at €39 a month |
Tip: analyse your “Other” answers too
If “How did you hear about us?” offers “Other” with a text box, every feature here works on those entries too. That's often where the channel missing from your list turns up, such as the parish newsletter.
Here are the six features in turn.
1. Response list: read and filter every free-text answer
Reading free text needs no setting up at all, because the response list is already waiting under Results in the Responses tab. Every plan includes it with all its filters, even the free one.
Laid out like a spreadsheet, the list gives each participation a row and each question a column, so free-text answers appear next to everything else that person said. Show more expands longer replies. Along the top, From and To set the period, and you choose between All participations and Completed only. Curious only about the unhappy customers? Filter by answer narrows the list to everyone who ticked “dissatisfied” on a choice question, leaving just their comments to read.
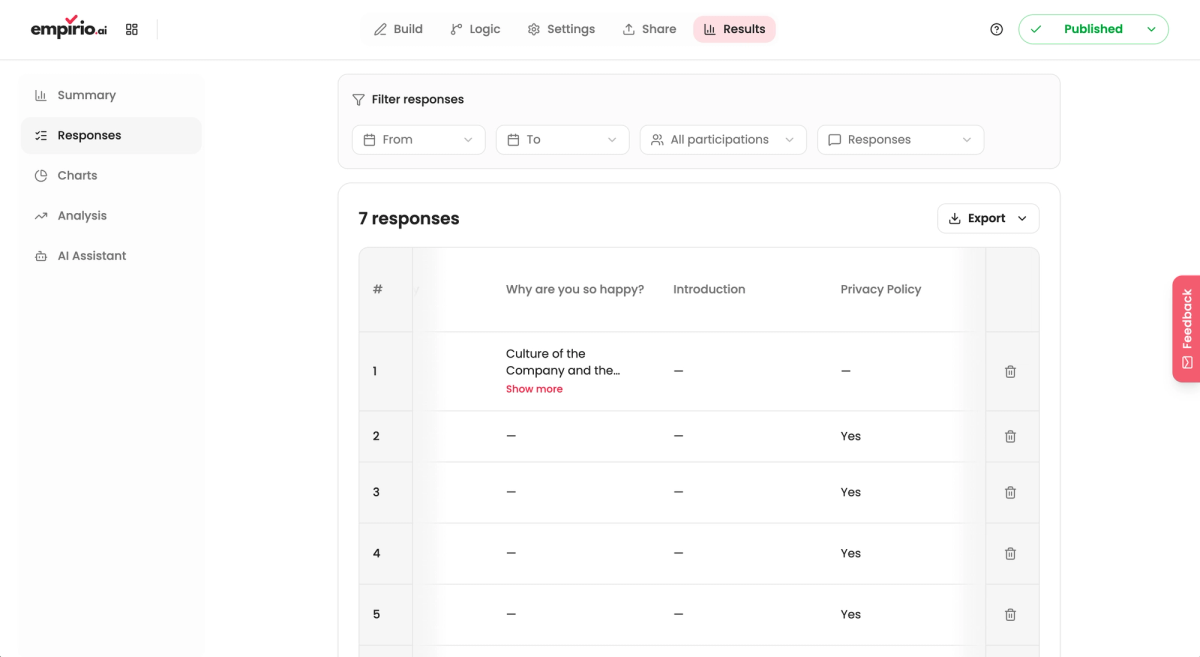
Fiona's 50 answers fit comfortably into this view. Callum's 2,400 are another matter, since after an hour of scrolling the three angriest comments tend to stick while the ten most common ones blur together.
A good fit if …
- only a modest number of people took part.
- you’d like to read each answer in the context of that person’s other replies.
Less of a fit if …
- the answers run into the hundreds.
- the report calls for figures on each topic.
Create a survey for free
With empirio.ai you can create a modern online survey in minutes — with hosting in the EU.
- AI-built survey
- Adjust by drag & drop
- Real-time analysis
2. Export: analyse the raw data in Excel or as a CSV file
If you're writing a dissertation, a quick look in the app won't be enough, because your supervisor will want to follow how you classified every single answer. That's what the export is for. You start it under Results in the Responses tab with the Export button, on the Lite plan and above for €19 a month.
You download all responses as an Excel or CSV file, with one row per participation and one column per question. Answers from an “Other” field get a column of their own. In Excel you add a column for your category beside the free-text column, fill it in answer by answer and count everything up at the end with a pivot table. The categorising itself works just as it does when you analyse a questionnaire: read first, then form categories, then count.
For a dissertation the export is the cleanest route, since every assignment stays traceable. If all you want is a quick idea of what people are writing about, though, typing in categories by hand is quite a lot of graft.
A good fit if …
- you want to do the coding yourself, for a dissertation, say.
- you’d like to carry on working with the free text in MAXQDA or SPSS.
Less of a fit if …
- you only want to know quickly what people are writing about.
3. Word cloud in the charts
In the word cloud from a guest survey at a B&B in the Lake District, the word “breakfast” stands out in big letters. You can tell at once that lots of guests are writing about it. Whether they loved the breakfast or couldn't stand it, however, the word cloud won't tell you.
The word cloud comes free with every plan. You'll find it under Results in the Charts tab, where empirio.ai shows a separate word cloud for each free-text question alongside the bar and pie charts for your other questions. The more often a term appears, the larger it's displayed.
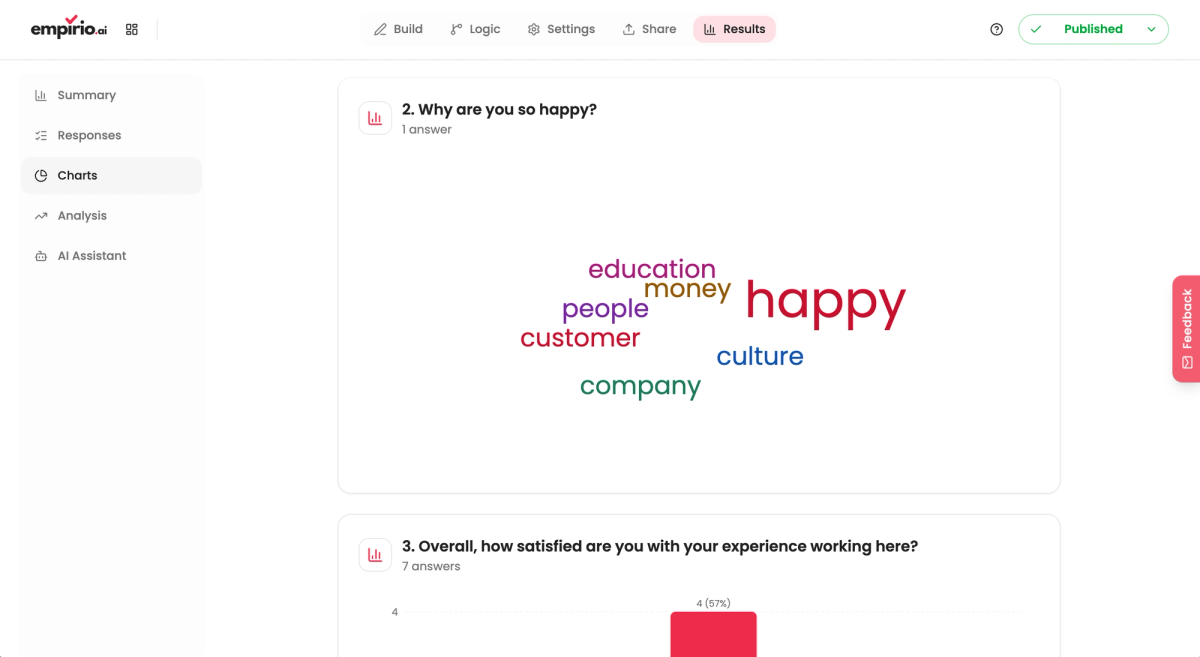
So use the word cloud as a first indication: at a glance you see which topics turn up in the answers at all. Whether the breakfast was praised or criticised, and why, only becomes clear once you go on to look at the answers in detail. The response list above and Text Analysis in the next section are both well suited to that.
A good fit if …
- you’d like a first impression within seconds.
- your report could do with a vivid picture.
Less of a fit if …
- you need solid statements about praise or criticism.
4. Text Analysis: top words, AI Analysis and all answers
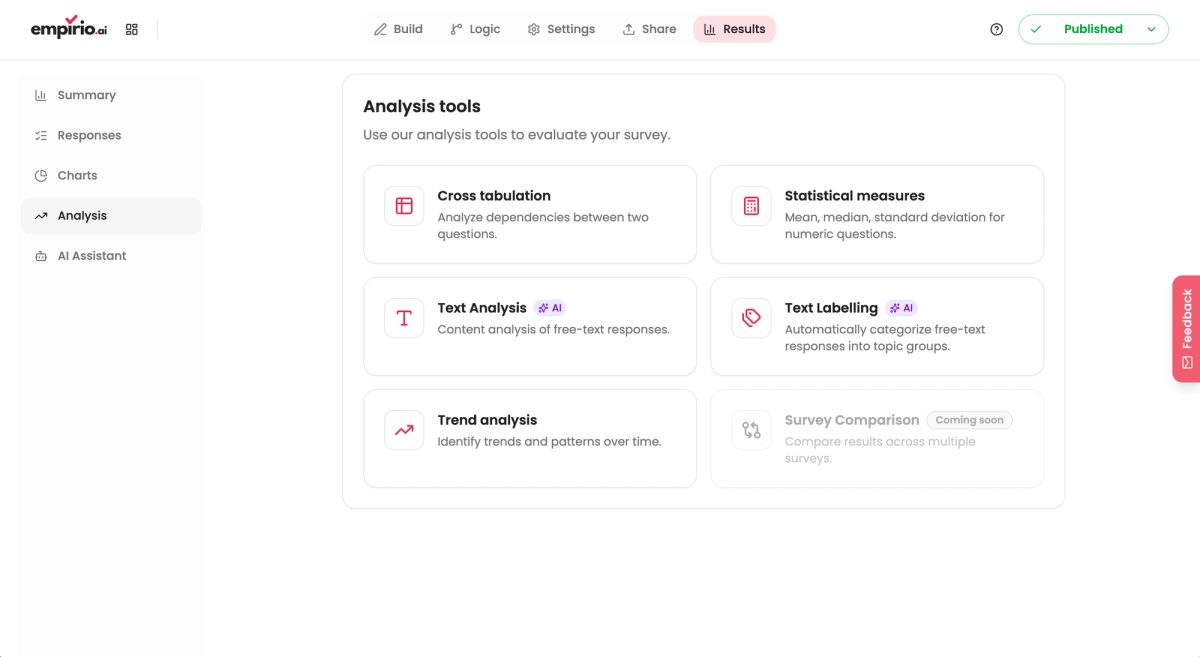
When the word cloud paints with too broad a brush, Text Analysis lets you dig deeper. It's the part of empirio.ai made for free-text answers alone, and it appears as a tile in the Analysis area under Results, beside Cross tabulation and Text Labelling. Testing it costs nothing, and for regular use you need the Plus plan at €39 a month.
Open the tile, pick the free-text question under Select question, and three tabs appear: Word Cloud, AI Analysis and Responses. Here's what each one does.
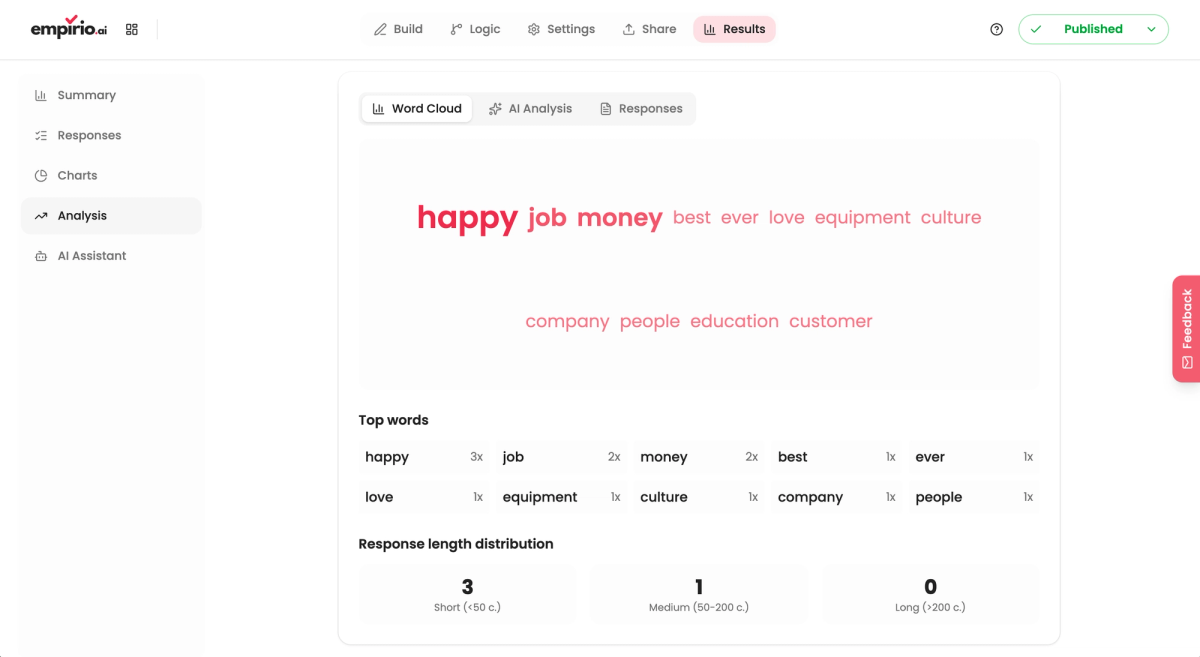
4.1 Word cloud with top words
Spotting “breakfast” looming large is a start, but under Top words you get the actual tally, say 37 mentions across 120 answers. The Response length distribution beside it sorts answers into short (under 50 characters), medium (50 to 200 characters) and long (over 200 characters). When plenty of people write at length, the subject has usually struck a nerve.
4.2 AI Analysis: summarise answers in one click
Time is often the real problem. Three hundred people have answered “What could we do better?”, and in an hour you're due to present the main points to the management team. There's no way you'll get through the lot. That's the moment for the AI Analysis tab, which condenses every answer to a free-text question into a summary for you.
You begin by choosing a focus from Identify main themes, Problems & criticism, Praise & positives, Sentiment analysis, Extract suggestions, Action recommendations, Notable quotes and Surprise me. Hit Run AI Analysis and back comes a Summary with matching Keywords, plus, depending on the focus you picked, Positive Statements, Critical Statements and Recommendations.
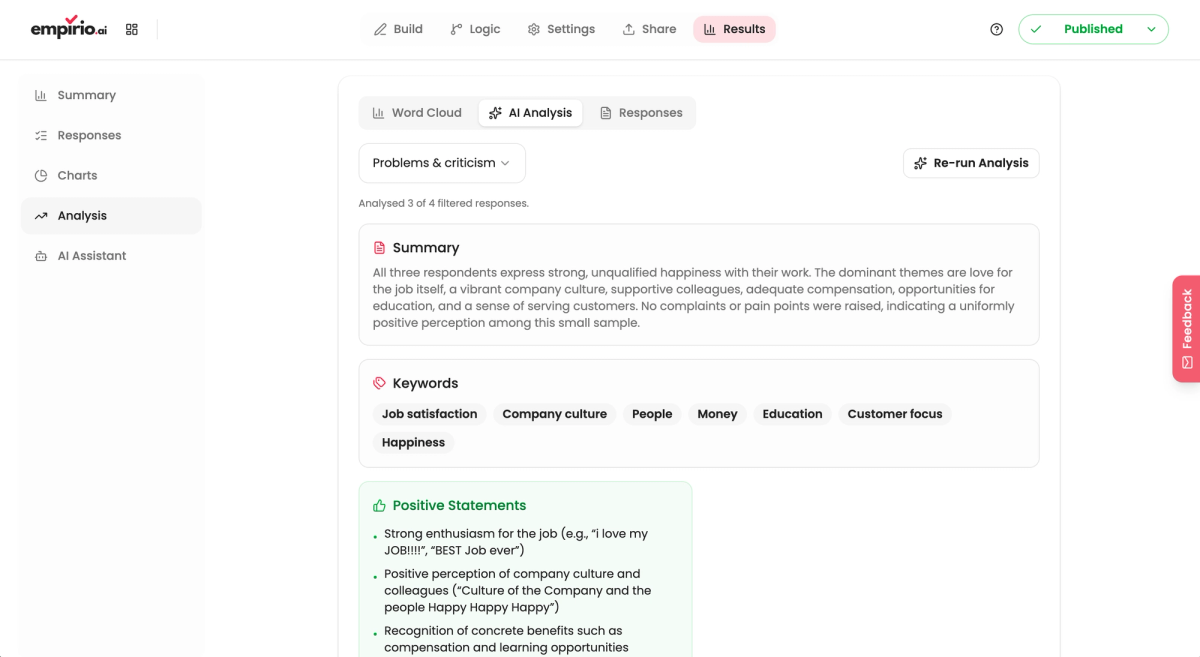
Just above the result, a line tells you how many answers went into it, for example 3 of 4 filtered responses. The date range and participation filters carry over to this tab as well. Re-run Analysis lets you try again with another focus. Because the AI decides for itself what to weight more heavily, dip into a few original answers on each theme before you take it into the meeting.
4.3 Read all the answers to one question in peace
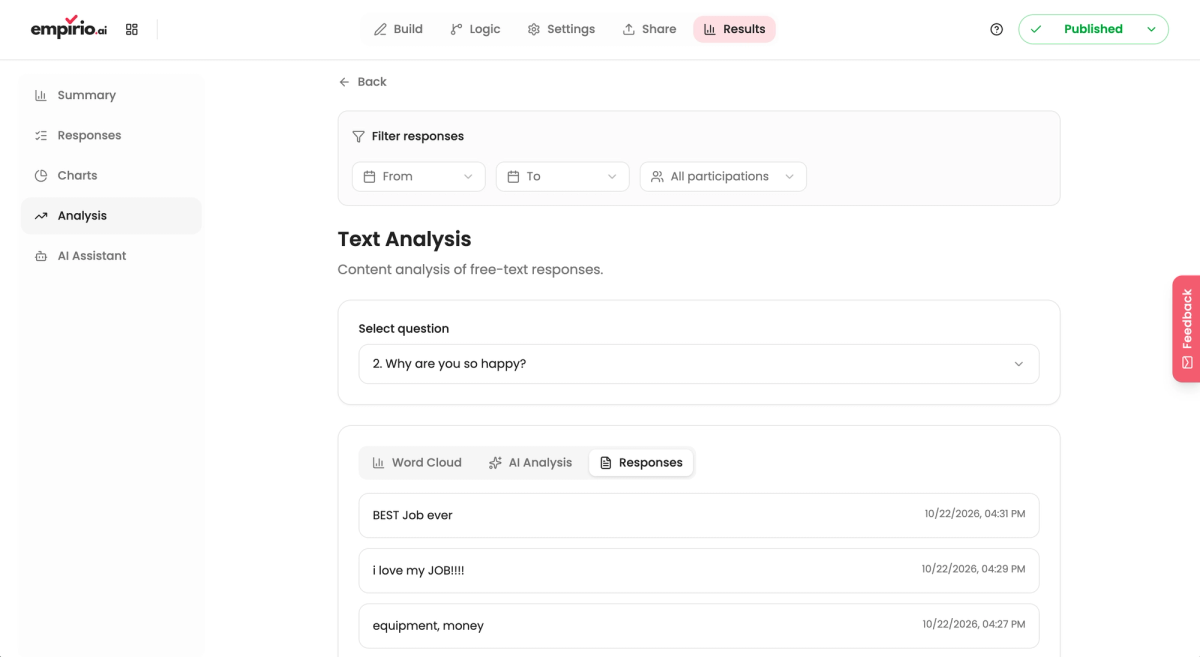
Under the Responses tab, only the answers to your chosen free-text question are listed, one after another and each with its timestamp. Without the other columns of the full response list, nothing pulls your attention away. So once an AI Analysis is done, this tab is the natural place to hold it up against the wording people actually used.
A good fit if …
- you want precise counts for particular terms.
- time is short, the pile of answers is large and you need to know which topics lead.
- you’d like to go through all the feedback on one question undisturbed.
Less of a fit if …
- most answers are only one or two words long.
- an AI result would go into a decision unchecked.
5. Text Labelling: sort answers into themes automatically
Where AI Analysis tells you what people are writing about, Text Labelling counts how many are writing about each theme. It files your free-text answers into themed groups without you lifting a finger, and you'll find it in the Analysis area under Results. Testing it is free of charge, and regular use comes with the Plus plan at €39 a month.
Inside the Text Labelling tile, choose a free-text question and press Generate labels. empirio.ai clusters the answers by meaning, names every cluster and gives each answer a label. Max. Labels caps how many labels it creates, and the Label distribution in the overview then shows how many answers each theme holds.
Think of the labels as a first draft. Rename, describe or delete them, create extra ones with New label and shift answers to wherever they fit better. Switch on Low confidence only to see the answers that sit loosely under their label, since those deserve a manual look. When you're done, the assignment can be exported as a table of answers and labels.
Clustering needs at least 20 text answers. The payoff is a line ready for your report, along the lines of “A third of the criticism is about how hard it is to get through on the phone”. Where a dissertation prescribes a fixed coding frame, coding by hand remains the better choice.
A good fit if …
- you need a countable result for each theme.
- you have well over 20 answers.
Less of a fit if …
- fewer than 20 text answers have come in.
- a fixed coding frame is prescribed.
6. AI Assistant: ask questions about your whole survey
Up to this point, each feature has dealt with one free-text question at a time. The AI Assistant, by contrast, takes in your survey as a whole. You'll find this chat under Results in the AI Assistant tab, where it can be tested free of charge before you keep it from the Plus plan onwards.
Questions go in just as you'd type them to a colleague, perhaps “Which trends stand out in the responses?” or “What would you improve first?”. Since it can see every question in the survey, the assistant connects the free text to everything else people told you. A charity could ask why the detractors in its Net Promoter Score gave low marks, and the assistant would summarise precisely those comments and recommend practical next steps.
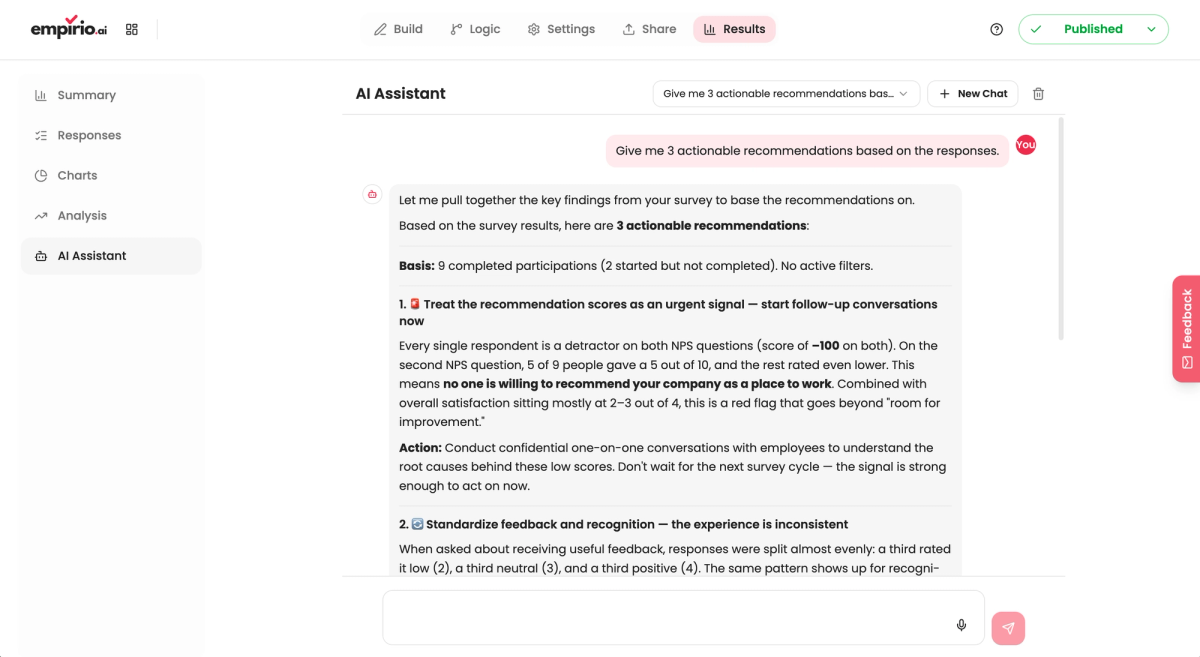
Again, look at the basis for each reply: the assistant states how many completed participations went into it and whether a filter is switched on. For exact frequencies in a report, the charts or Text Labelling remain the safer place to count.
A good fit if …
- your question reaches beyond one free-text question.
- you’d like practical actions to come out of the results.
Less of a fit if …
- your report depends on exact frequencies.
Combining the features: a workflow in 5 steps
Callum's customer survey makes it concrete. His first 120 answers to “What could we do better?” are in, and five steps take him from a rough overview to a figure he can stand behind. Fiona could use exactly the same routine for her team survey, and so could anyone collecting feedback after a workshop.
- Skim-read. Open the Responses tab in Text Analysis and scroll through everything once, without sorting yet. With a very large pile, a few dozen answers picked at random will do.
- Check the frequent terms. The word cloud and top words reveal which topics keep cropping up. In Callum's case, “waiting” and “phone” lead the list.
- Form themes. Either run AI Analysis with the Identify main themes focus or generate labels in Text Labelling. If there are only a few answers, simply draw up the categories yourself.
- Cross-check. For each theme, read a handful of original answers and work through the uncertain assignments in Text Labelling. A label whose name doesn't match its contents gets renamed.
- Report figures and quotes. Give every theme its number of answers and add one or two quotes that sound typical.
In Callum's report, that becomes a sentence such as: “Of 120 answers to the question about improvements, 38 concern waiting times on the phone.” The number makes the point hard to argue with, and a quote beside it lets readers hear the customer's own voice.
Read free text first, then sort it, then count it.
Common mistakes when analysing open-ended questions
Sorting rarely goes wrong, but reporting is where things slip. Five mistakes come up again and again.
Presenting the word cloud as the result
“Service” fills half the slide in giant letters, and the room nods approvingly. Yet nobody present could say whether the service was praised or slated. A word cloud reveals which topics come up, not what was said about them, so it makes a good opener and a nice visual for your report but never proof of anything.
Accepting the AI summary without checking it
The AI reports that “many people would like longer opening hours at the leisure centre”. Going back to the answers, you count exactly two mentions out of 150. Summaries like this read smoothly and persuasively even when a topic barely features, so test every statement destined for your report against the originals and note how many answers support it.
Mistaking the loudest voices for the majority
Two furious paragraphs lodge in your memory far more easily than twenty brief “all fine” replies. Unhappy people tend to write at greater length and with sharper words. Rely on counting rather than on your gut feeling, and set the free text against what your closed questions show.
Breaking anonymity with quotes
“Since we moved into the annex behind the town hall, nothing in our team works any more”: in a department of five, everybody can tell at once who wrote that. Writing style, a project that gets mentioned or a reference to someone's own team can give away far more than people expect. Having promised an anonymous survey, pass quotes on only in shortened or paraphrased form, without names or identifying details.
Only passing on the summary
At a regional charity, HR analyses the staff survey and the board of trustees eventually gets a slide reading “Communication: 23 mentions”. The comments behind that figure, such as “I only hear about important decisions on the grapevine”, never make it into the boardroom. Each step from single answer to category to presentation strips away some meaning and detail, until the people deciding see only the condensed version.
We'd therefore recommend reading as many free-text answers as you can yourself, even when someone else ran the analysis. Whenever you pass results on, attach a few typical original answers to each category, anonymised and trimmed. The trustees then get a real sense of what people think.
Watch out with external AI tools
Paste free text into a chatbot and the answers leave your survey, frequently landing with providers outside the EU. empirio.ai keeps survey data and AI processing in the EU. If you do turn to a chatbot now and then, keep the advice from our guide to running a survey with ChatGPT in mind.
Checklist before you report
- Each category and label has a clear, telling name.
- Every topic comes with its number of answers.
- Quotes are representative rather than merely dramatic.
- AI findings have been checked against the original answers.
- The same filters were used throughout, and they are noted down.
- No quote lets anyone identify an individual.
- Recipients of the results also see some original answers.
Conclusion
A yes or no question shows how many people are satisfied, and the free-text question explains why. The right way to analyse the answers depends on their number, the depth you're after and the purpose behind your question. Our advice is to read as many as you can yourself, call on the word cloud, AI Analysis and Text Labelling once the volume grows, and report figures with a few typical quotes alongside them.
Where to go next
- Looking to word better open-ended questions? Open-ended questions: definition and examples
- Fancy comparing groups across your choice questions? How to create a cross tabulation
- Wondering what your customers really think? The customer survey guide
Want your free text analysed without reading every answer yourself?
On empirio.ai, the AI summarises your free-text answers and groups them into themes. Try it free, with 100% EU hosting that covers the AI too.