

Picture the evaluation form at the end of a class: “I could follow the explanations easily”, with five boxes underneath running from “strongly disagree” to “strongly agree”. Almost everyone has checked one of those boxes without ever learning what the format is called.
It is called a Likert scale. A Likert scale measures attitudes by putting several statements about the same topic on one shared set of graded answer options, usually five or seven steps running from clear disagreement to clear agreement, and then combining the answers to those statements into a single score for each respondent. By the end of this article you will know how many points your scale needs, how to label them and what you are allowed to calculate afterward.
📌 Key points at a glance
- Rensis Likert introduced the method in his 1932 doctoral thesis.
- A single question is a Likert item, not a Likert scale.
- Pew Research Center warns that agree-disagree wording invites acquiescence bias.
- Every point gets a word, not just the two ends.
- Likert himself never claimed the points were equally spaced.
Create a survey for free
With empirio.ai you can create a modern online survey in minutes — free to start.
- AI-built survey
- Adjust by drag & drop
- Real-time analysis
What is a Likert scale?
A Likert scale is a measurement technique from social research in which respondents agree or disagree with several statements about the same topic, each time using the same graded answer options. The individual answers are then combined into a total or average score describing that person’s attitude.
The technique goes back to the American social psychologist Rensis Likert, who set it out in his 1932 doctoral thesis at Columbia University, published as issue 140 of the Archives of Psychology under the title A Technique for the Measurement of Attitudes. What drove him was economy rather than theory: the established methods of his day demanded elaborate preliminary studies, and he wanted to know whether something simpler would do. It would. His scale on attitudes toward international relations reached the same reliability with 24 statements as a rival method did with 44 (Likert 1932, p. 33). Half the questions, the same quality of result, which is precisely why the format now sits in almost every questionnaire.
In psychology an instrument of this kind is called a psychometric scale. It measures something that cannot be observed directly through answers that can be observed. Attitude, satisfaction and motivation are invisible. What is visible is which box somebody checks.
A Likert item and a Likert scale are not the same thing
This distinction is skipped almost everywhere, teaching material included. A single question with five graded options is a Likert item. A Likert scale only comes into being once you ask several such items about the same characteristic and combine their values into one figure. Likert puts it plainly in the original: each statement is “a scale in itself”, and the individual scores are then combined using a median or a mean (Likert 1932, p. 24).
In a thesis this is the point where a defense can turn awkward. Calling one question a “Likert scale” and then averaging it packs two mistakes into a single sentence. Asking six statements about content, pace, instruction, materials, room and organization and building a satisfaction score from them, by contrast, is a scale.
One check box is an item. It only becomes a scale through several items and a shared analysis.
Our reading tip: Likert’s original paper is freely available and, at 55 pages, far shorter than the reputation of a classic suggests. Anyone citing it properly will need to open it anyway.
Likert scale examples, and the wording Pew warns about
The question people actually run into is not what a Likert scale is, but what the points should be called. The default answer, agree-disagree wording, is also the one American survey methodologists are most skeptical of.
Pew Research Center describes the agree-disagree format as one of the most common in survey questions and then explains why it misleads: “Research has shown that, compared with the better educated and better informed, less educated and less informed respondents have a greater tendency to agree with such statements.” Pew calls this acquiescence bias and notes it is stronger when an interviewer is present than when the survey is self-administered.
| Continuum | What it captures | The points |
|---|---|---|
| Agreement | support for a statement | strongly disagree, disagree, neither, agree, strongly agree |
| Frequency | how often something happens | never, rarely, occasionally, often, always |
| Satisfaction | how content someone is | very dissatisfied, somewhat dissatisfied, neither, somewhat satisfied, very satisfied |
| Quality | how good something is | poor, only fair, good, excellent |
The quality wording is the four-point set Pew Research Center cites as an example of ordinal response categories.
The alternative Pew recommends
Pew’s own guidance does not stop at the warning. Its recommendation is direct: “A better practice is to offer respondents a choice between alternative statements.” Instead of asking whether someone agrees that short wait times matter, you present two positions and let the respondent pick the one closer to their view.
Where a forced choice is too blunt for what you are measuring, the next best move is an item-specific scale. Rather than “Short wait times are important to me: agree”, ask “How important are short wait times to you: extremely important to not important at all”. Both versions remove the pull toward saying yes.
Never shuffle the order of the points
Survey tools often offer to randomize answer options, which is useful for lists of unranked choices and wrong here. Pew states the rule plainly for ordinal categories: they “are generally not randomized because the order of the categories conveys important information to help respondents answer the question.”
A Likert scale is ordinal by construction. Its order is part of the measurement, so it stays fixed for every respondent.
How many points should a Likert scale have?
Five to seven points is the working rule in the methods literature, and American practitioners often argue for the lower end of it. Pew Research Center puts the ceiling lower still: “In most circumstances, the number of answer choices should be kept to a relatively small number – just four or perhaps five at most – especially in telephone surveys.”
The reasoning is about memory rather than statistics. Pew points to psychological research indicating that people struggle to hold more than that many choices in mind at once. On a self-administered web survey, where the options stay visible on screen, the constraint is looser, which is why five and seven points are both defensible online.
Five, six or seven points: what actually changes
An odd number has a middle, an even number does not. That is the real difference, not the fineness of the gradation. A six-point Likert scale is therefore mainly a forced choice: anyone who is undecided still has to pick a side.
Whether that is good or bad depends on the purpose. In an evaluation meant to prompt improvements, a forced lean is often useful, because a column of middle checks helps nobody. In an opinion survey, where genuine indecision is a finding in its own right, it distorts.
Does your scale need a neutral middle?
The middle category is the most argued-over single decision in scale design, and both sides have real arguments. Both fit into a few lines.
What the middle gives you
- People who are genuinely undecided can say so.
- Neutral respondents do not drift into a wrong neighboring point.
- The scale stays symmetrical on both sides.
What you accept in return
- The middle also gets checked out of convenience.
- Some choose it instead of saying “don’t know”.
- Your analysis cannot tell those two apart.
Curiously, Rensis Likert never discussed the question at all. In his 1932 paper the “undecided” category appears purely as a scoring instruction, with the value 3 assigned to it (Likert 1932, appendix). The entire debate about the neutral point came after him.
How to create a Likert scale, step by step
You do not build a Likert scale by writing one question and putting five boxes next to it. You build it by breaking a characteristic into several statements that all mean the same thing but come at it from different angles.
The six steps below work for a course evaluation just as well as for the empirical chapter of a thesis. Allow more time for the first step than for all the others combined.
- Define the characteristic. Write down in one sentence what you want to measure. “Satisfaction with the class” is a characteristic, “opinions about the class” is not.
- Write the statements. Five to ten short sentences, each carrying exactly one idea. Two topics in one sentence make the answer useless.
- Reverse some of them. Word part of your statements negatively so that anyone checking the same column throughout stands out. Likert already recommends this in the appendix of his 1932 paper.
- Pick a scale and keep it. Decide once for five or seven points and use the same one across the whole questionnaire.
- Label every point. Each step gets a word, not just the two ends. Numbers on their own are not enough.
- Run a pilot. Ask five people who do not know your topic to complete it, then ask them how they read the middle point.
Technically a Likert scale is a matrix question: several statements underneath each other, the same answer scale alongside. In empirio.ai, an online survey tool from Germany, you set it up as a matrix question and define the scale once for all statements. How to build the rest of the questionnaire around it is covered in the guide to creating a questionnaire.
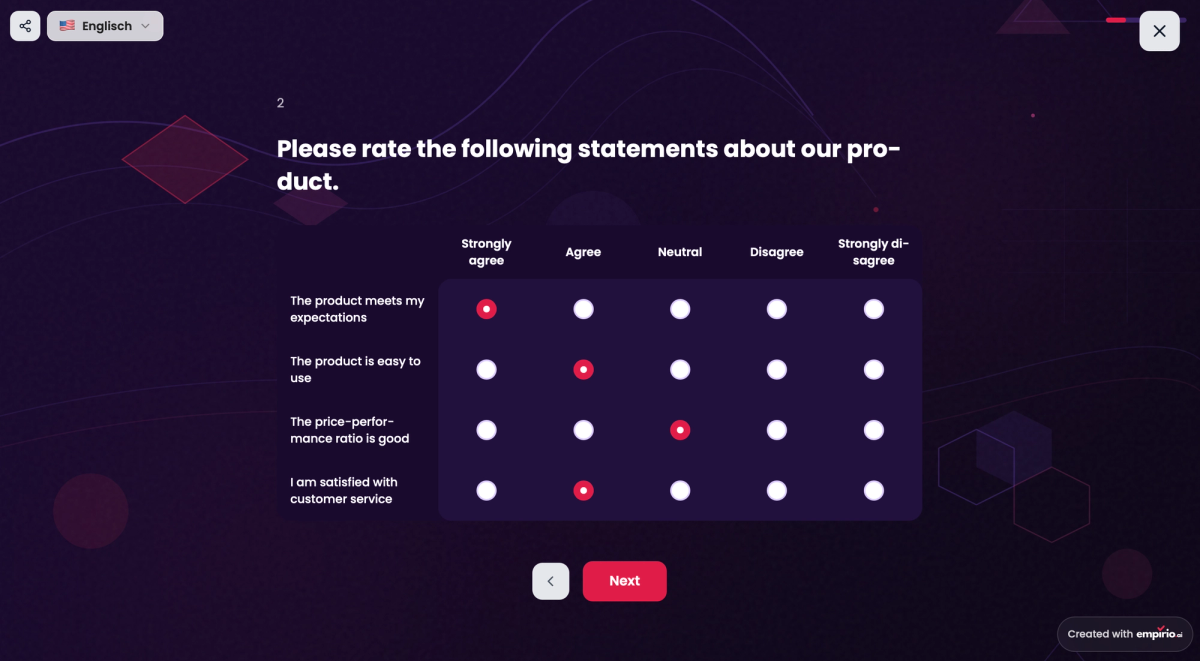
That layout is exactly what the term matrix question means: the scale appears once as a column header, and every row below it is a separate statement about the same characteristic. The four rows in the example add up to one satisfaction score, while a single row on its own is only a Likert item.
Create a survey for free
With empirio.ai you can create a modern online survey in minutes — free to start.
- AI-built survey
- Adjust by drag & drop
- Real-time analysis
Is a Likert scale ordinal or interval?
A single Likert item is ordinal. You know that “agree” means more agreement than “neither agree nor disagree”, but you do not know whether the gap between those two points is the same size as the gap between “neither” and “disagree”.
The combined score from several items, by contrast, is usually treated in research practice as if it were interval data. That is a convention with a rationale rather than a mathematical truth: the more items feed into the score, the finer the resulting scale becomes, and the less the unevenness of the individual steps matters.
If you want to look the terms up: the ordinal scale only knows a rank order, while the interval scale adds equal distances. Which calculations belong to which level is set out in the overview of levels of measurement.
What Rensis Likert actually wrote about it
This is where the original repays a look, because it says something different from what is commonly claimed. Likert claimed equal units only for his laborious sigma method, never for the simple practice of assigning the numbers 1 to 5.
His Table II shows both side by side. The five points of one of his statements carry the sigma values −1.63, −0.43, +0.43, +0.99 and +1.76 (Likert 1932, p. 23). The gaps are therefore 1.20, then 0.86, then 0.56, then 0.77. Anyone assigning 1, 2, 3, 4, 5 instead is asserting the same gap four times over. Likert knew this and justified the shortcut on purely practical grounds: the two methods correlated at +0.99, so the simpler calculation was defensible “for all ordinary purposes” (Likert 1932, p. 43).
Two things follow for you. First, “ordinal or interval” has no single correct answer, only a decision. Second, that decision does not need an argument, it needs a rule you stick to and justify in your methods chapter.
Does a Likert scale require a normal distribution?
No, your collected data do not have to be normally distributed for a Likert scale to be appropriate. The confusion arises because Likert assumed, for his sigma calculation, that attitudes are distributed roughly normally in the population.
He immediately added that he was fully aware of the dangers of that assumption, that it was only an experimental step and that further work should either render it unnecessary or prove it justified (Likert 1932, p. 22). For a straightforward analysis using the numbers 1 to 5 the assumption plays no part at all. Normality becomes relevant again only when you apply particular statistical tests to your scale scores.
How to analyze a Likert scale: median, mean or frequencies?
The analysis depends on whether you are holding a single item or a scale built from several items. That one distinction settles most of the arguments you would otherwise have with an advisor.
For a single item the frequency distribution is the most honest presentation, meaning the share of respondents at each point. The median (= the value in the middle of all ordered answers) and the mode (= the most frequently chosen point) fit alongside it. A mean over a single ordinal item is open to challenge, because it assumes equal distances you cannot evidence.
For a scale built from several items you first form the total or average score per person and then work on with that figure. This is exactly what Likert proposed (Likert 1932, p. 26). Before that you check whether the items measure the same thing at all, usually via Cronbach’s alpha. Which methods come next is covered in the overview of analysis methods.
Collapsing a Likert scale: the top-two box
Market research routinely merges the two agreeing points into a single figure, known as the top-two box. “Agree” and “strongly agree” then become one percentage that is easy to report in a presentation.
That is legitimate and often sensible, but it costs information. Once you merge, you can no longer see whether the agreement is made up of convinced or of cautious answers. Report both: the top-two box and the full distribution.
💡 Tip
Always record how many people skipped a statement. A mean based on 40 answers and one based on 120 look identical in a table and are not.
Common mistakes with Likert scales
The five mistakes below turn up in club surveys as readily as in graduate theses. All of them only show up during analysis, when the answers are already in and nothing can be changed.
What they have in common is that half an hour before you send the survey out is enough to fix them. Afterward it is not.
Asking for agreement where a direct question would work
Scales of the “agree, disagree” type systematically produce more agreement than scales that ask about the thing itself. Pew Research Center names the effect acquiescence bias and recommends offering a choice between alternative statements instead. Where that is impractical, an item-specific scale does the same job: ask “How satisfied are you with the class” rather than “I am satisfied with the class: agree”.
Labeling only the two ends
A scale with “very dissatisfied” on the left, “very satisfied” on the right and nothing but numbers in between is quick to build and worse. Fully labeled scales achieve higher reliability and validity, and respondents prefer them. Words also survive translation into a report, where a bare 3.7 does not explain itself.
Numbering with negative values
Numbering from −2 to +2 looks symmetrical but does not behave symmetrically. Respondents avoid the negative side and answer more positively overall than they would on a 1 to 5 numbering. Keep the numbers positive and let the words carry the direction.
Randomizing or switching the scale
Ordinal categories keep their order for every respondent, because the order is part of the information. Nor can you use five points in the first half of your questionnaire and seven in the second and then analyze them together.
Two statements in one sentence
“The class was well structured and easy to follow” measures two things. Anyone who liked the structure but not the explanations cannot answer, and checks the middle. Likert described such double-barreled statements as grounds for exclusion back in 1932. How to keep questions clean is covered in the guide to question types in surveys.
Conclusion
The Likert scale is so widespread because it measures reliably for very little effort, and it is so often misused because it looks simple. Two things will keep you clear of most of the traps: a scale needs several statements, and every point needs a word. Everything else, from the number of points to the middle category, is a trade-off you can justify in your methods section. Only one claim should never be taken on trust, textbooks included: that the points are equally spaced. Rensis Likert never said so.
Where to go next
- Want to sort out the types of scale? Rating scale: unipolar, bipolar and how many points
- Need the right level of measurement? Determining the level of measurement
- Building the whole questionnaire? Creating a questionnaire: structure and order
- Want to know whether your results hold? Objectivity, reliability and validity
Scale ready, survey still missing?
With empirio.ai, an online survey tool from Germany, you set your Likert statements up as a matrix question and share the survey as a link or a QR code.