

Picture two people scoring the same questionnaire and arriving at two different results. The questionnaire is not badly worded. It is simply not objective.
Objectivity, reliability and validity are the three quality criteria that quantitative research is judged by, and American testing practice sorts the same ground differently. Objectivity means that the result does not depend on who administers, scores and interprets the study. Reliability means that an instrument measures precisely, with the smallest possible measurement error. Validity means that the evidence supports the interpretation you want to draw from the scores. By the end you can say, for your own study, which criterion you meet and which one you leave open on purpose.
📌 Key takeaways
- Objectivity means the result does not depend on the scorer.
- Reliability means the instrument measures with little measurement error.
- Validity belongs to the interpretation, not to the questionnaire.
- AERA, APA and NCME name validity, reliability and fairness.
- Moosbrugger and Kelava list ten quality criteria, not three.
Create a survey for free
With empirio.ai you can create a modern online survey in minutes — free to start.
- AI-built survey
- Adjust by drag & drop
- Real-time analysis
Objectivity, reliability, validity: the three quality criteria at a glance
Objectivity, reliability and validity are the three criteria by which the quality of a measuring instrument is judged, and they are worked through in that order. Behind them sit three questions: does the measurement depend on the person running it, is it precise, and does it capture the right thing?
The order is not habit. Rather, it mirrors what each criterion needs from the one before it. A study in which every scorer arrives at a different value cannot be precise, and an imprecise measurement cannot be valid. How strict that dependency is depends on the pair: test theory states it as a formal condition for reliability and validity, and not for objectivity and reliability.
| Quality criterion | The question behind it | What you anchor it to |
|---|---|---|
| Objectivity | Does the result depend on the person? | fixed rules for administration, scoring, interpretation |
| Reliability | Does a repeat produce the same score? | a reliability coefficient between 0 and 1 |
| Validity | Is the intended trait really measured? | evidence from content, structure and other variables |
Three foundations instead of three criteria: how the US standards sort the field
Standards for Educational and Psychological Testing, the reference work of American testing practice, does not use the triad at all. Published jointly by the American Educational Research Association (AERA), the American Psychological Association (APA) and the National Council on Measurement in Education (NCME), the 2014 edition organizes the whole field under three foundations: validity, reliability/precision, and fairness. Objectivity is not one of them. Fairness, by contrast, was raised to a coequal chapter of its own in the 2014 revision, after having been spread across several chapters before, and the volume has been an open access download since March 2021, available on the open access page of testingstandards.net.
What many guides leave out on the other side: the triad is not the full list there either. Helfried Moosbrugger and Augustin Kelava name ten quality criteria in their German-language textbook on test theory and questionnaire construction, and next to the three main ones they list scaling, norming, economy, usefulness, reasonableness, resistance to faking and fairness, set out in chapter 2 of that textbook (Springer, 2012).
For a thesis or a capstone project, working with the three main criteria is almost always enough. What matters is that you know you are making a selection and can say which framework you are working in. Anyone who can also name the seven remaining quality criteria of empirical research methods sounds noticeably more secure in front of a committee.
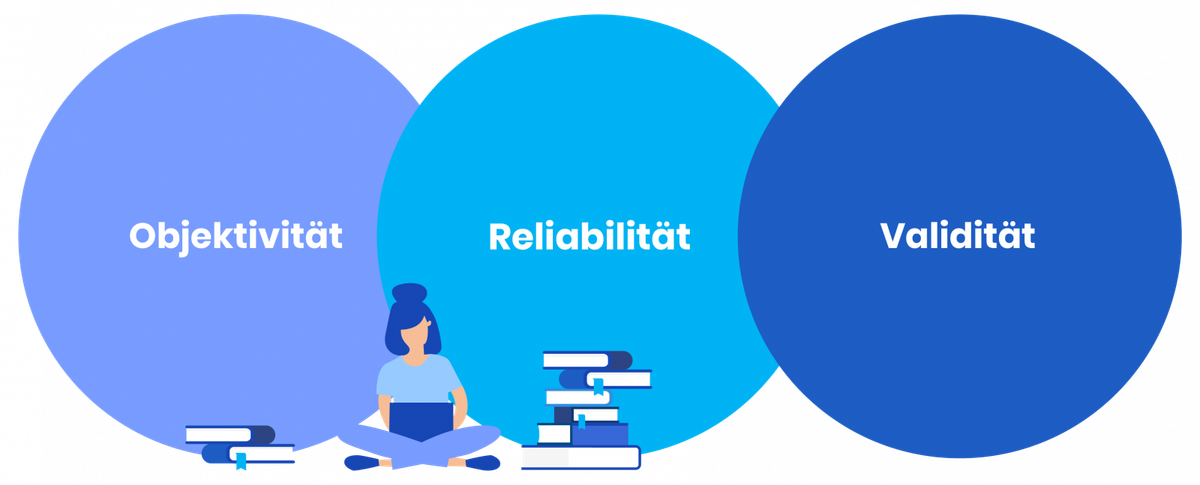
Objectivity: does the result depend on the person running the questionnaire?
Objectivity is met when a test measures the trait it measures independently of who administers it and who scores it, and when the rules for interpreting the result leave the user no room. Put plainly: whoever runs the study gets no discretion.
In an online survey the criterion is easier to meet than in any spoken procedure, because no conversation takes place between the researcher and the person answering. Precisely for that reason the standardized online survey is so popular in student projects. The three aspects of objectivity go back to Gustav Lienert and Ulrich Raatz (1998), Moosbrugger and Kelava adopt them in that form, and in a thesis all three are argued separately.
Administration objectivity: the same conditions for everyone
Administration objectivity is met when the result does not depend on who runs the study. The lever for it is standardization: instructions, order of items, time limits and answer formats are fixed in advance and do not change between two participants. Moosbrugger and Kelava describe the ideal as a situation in which the person answering is the only source of variation. Whoever sets up an online survey meets that ideal almost automatically: the questionnaire gets built once and then goes out to every participant in identical form, with nobody reading it out, explaining it or answering questions about it.
Scoring objectivity: the same answers, the same score
Scoring objectivity is met when identical answers lead different people to the same result. With closed-ended questions and fixed answer options nothing is left to interpret, so the aspect is unproblematic. As soon as you work with open-ended questions, scoring objectivity drops, because free text has to be sorted into categories. That is no reason to avoid them, but it does call for a coding scheme you can show. Agreement between two people coding the same answers can also be put into a single number as inter-rater reliability, and a number is what turns a claim into evidence.
AERA, APA and NCME raise a version of the same problem that no older textbook could have anticipated: when scoring runs through a proprietary algorithm, as in automated essay scoring, the people using the scores still need a way to evaluate how those scores come about. Handing the coding of free-text answers to a tool inherits that question in miniature.
Interpretation objectivity: the same numbers, the same conclusion
Interpretation objectivity is met when different specialists draw the same conclusion from the same number. In practice it is the weakest of the three aspects, because it would require norms or clear thresholds, and a study of your own without a norming sample has neither. What you do instead: fix the interpretation rules in advance and name them in your methods section, rather than shaping them around the result afterward.
Tip
Write the coding rules for your open-ended questions before you read the first answer. Whoever builds the scheme on the finished data set can no longer rule out that the categories were shaped to fit the desired result. In a defense that is the most uncomfortable question of all.
Reliability: does a repeat measurement produce the same result?
Reliability is the precision of a measurement. A test is reliable when it measures the trait it measures without measurement error, and the reliability coefficient expresses that on a scale from 0 to 1.
A coefficient of 1 means the measurement is free of measurement error, a coefficient of 0 means the value came about through measurement error alone. Moosbrugger and Kelava write that the reliability coefficient of a good test should not fall below 0.7. The number circulates online without a source far too often. Chapter 2 of the textbook gives it as a target figure, not as a cut off for an unusable scale. In the framework of AERA, APA and NCME the second foundation is called reliability/precision, and whether 0.7 is enough depends on what the scores will be used for.
Four procedures are common for determining reliability in classical test theory. Which of them is an option for your project depends less on statistics than on whether you can reach your respondents a second time.
| Procedure | How it works | Feasible in a thesis? |
|---|---|---|
| Test-retest reliability | the same test at two time points, scores correlated | rarely, respondents are hard to reach again |
| Parallel-test reliability | two equivalent forms of the same test | hardly, the item pool is too small |
| Split-half | test divided in two halves, halves correlated | yes, with the Spearman-Brown correction |
| Internal consistency | each item as its own part, usually Cronbach’s alpha | yes, the normal case |
Parallel-test reliability counts as the royal road in test theory, because it rules out practice and memory effects. For a thesis it is nonetheless almost never feasible, since it calls for two questionnaire versions with the same true scores. Almost everyone lands on internal consistency.
Cronbach’s alpha: what the value delivers and what it does not
Cronbach’s alpha measures how strongly the items of a scale hang together and is therefore a measure of internal consistency. The value is popular because every statistics package prints it, and it gets overinterpreted just as often. A high alpha does not show that a scale measures only one trait, and it rises simply because a scale gets more items. The assumption behind it is strict as well: all items are supposed to load equally on the same trait. Where that does not hold, alpha underestimates the actual reliability. Klaas Sijtsma set out these limitations at length in the journal Psychometrika in 2009, and McDonald’s omega has often been named as the alternative since.
For a thesis that does not mean you have to compute omega. It means you place alpha with half a sentence instead of presenting it as proof. Exactly those placements separate a good methods discussion from an average one.
What to do when Cronbach’s alpha comes out too low
A low alpha is no reason to pull a scale out of the thesis quietly. The value is a finding, and three defensible routes lead out of it: report the scale as it stands, drop single items with a stated reason, or move the analysis to the individual items. The item-rest correlations of the scale show which route fits.
Item discrimination usually gets reported as the item-rest correlation, the relationship between one item and the sum of the remaining items on the same scale. The item-total correlation counts the item into that sum and therefore comes out systematically higher, noticeably so on short scales. An item with a very low item-rest correlation is the first candidate for removal. A negative sign in front of it is worth checking against the coding first, because a reverse-worded question left unrecoded is the most common purely technical reason for a broken alpha.
Two boundary conditions belong in the write-up. Scale length is the first: alpha climbs with the number of items even when the measurement gets no better, and a three-item scale rarely reaches high values. The number of usable responses is the second: on small samples the alpha estimate swings widely and turns into a shaky point estimate rather than a result.
Alpha gets computed with statistics software, not by hand. SPSS prints the coefficient and the item-rest correlations in one output, the psych package in R does the same, and JASP and jamovi are free interfaces that supply both numbers. The precondition in every case is that the items form a scale at all: the same answer format, the same number of points, the same direction. A Likert scale is the normal case.
Inter-rater reliability: when two people judge the same material
Inter-rater reliability measures how far two or more people judging independently arrive at the same assessment of the same material. The measure becomes necessary as soon as data get assigned rather than checked off: open-ended answers, observations, interview passages, judgments about texts or images.
Inside the system of the three quality criteria, inter-rater reliability sits on a seam. What gets measured is agreement between people, which makes it a check on scoring objectivity at heart. Convention reports it as reliability all the same, because the coefficient expresses a share of measurement error like any other reliability coefficient. The framework of AERA, APA and NCME names no objectivity criterion at all, which is one reason American write-ups file an agreement figure under reliability/precision. In a thesis the number therefore shows up in either chapter, and both are defensible as long as you say why it stands where it does.
Inter-rater, intra-rater, intercoder: who gets compared with whom
The four common terms differ in who gets compared, not in how the number is computed. The same formula therefore shows up under different names, and the confusion is widespread for that reason. For a methods section what counts is picking the name that matches your material.
- Inter-rater reliability: two or more people judge the same material, which is the normal case in a thesis with open-ended questions.
- Intra-rater reliability: the same person judges the same material a second time, with time in between. The coefficient shows whether a coding scheme stays stable even for a single coder.
- Intercoder reliability: the same idea in content analysis, where the people judging are called coders. Inter-rater and intercoder mean the same thing in practice.
- Inter-observer reliability: the same idea in observational research, where behavior gets recorded rather than material coded.
Cohen’s kappa, Krippendorff’s alpha and the ICC
Percent agreement on its own does not carry the argument, because two people also agree often enough by chance. The fewer categories a coding scheme holds, the larger that chance share gets: with two categories, blind guessing lands on the right one in roughly half of all cases. The common coefficients therefore take the chance share out.
| Coefficient | What it is built for | Typical case in a thesis |
|---|---|---|
| Cohen’s kappa | two raters, categories without a rank order | two people code open-ended answers into a coding scheme |
| Fleiss’ kappa | more than two raters | a coding group instead of a pair |
| Krippendorff’s alpha | any number of raters, also with missing values and with ranked scales | content analysis where not everyone coded everything |
| Intraclass correlation (ICC) | judgments on a numerical scale rather than in categories | several people award point scores |
No threshold for the height of these values follows from a standard. Classifications that speak of substantial agreement from around 0.6 and of very high agreement from around 0.8 are widespread; they go back to proposals by individual authors rather than to a binding norm. Name the value, the procedure you used and the source of the classification you lean on, rather than presenting a boundary as given.
Collecting inter-rater reliability in your own study
The effort is smaller than the terminology suggests, and the work arrives anyway as soon as open-ended questions sit in the questionnaire. Five steps are enough, and the third one decides everything: without an independent judgment there is no number that proves anything.
- Write the coding scheme before the first answer gets read, with a description and one example per category.
- Brief a second person, usually a fellow student.
- Both of you code the same portion of the material independently, often ten to twenty percent of the answers.
- Compute the coefficient, talk through the disagreements, sharpen the coding scheme.
- Code the remaining material only afterward, and report the value from the first round.
What comes out of those five steps is more than a number in the methods section. A coding scheme that two people can apply the same way is what makes the analysis that follows traceable at all. How the path runs from there to frequencies, means and cross-tabulations is set out in the guide to evaluating a questionnaire.
Validity: is the questionnaire measuring what you actually mean?
Validity, in the framework of AERA, APA and NCME (2014), is the degree to which evidence and theory support the interpretation of test scores for a proposed use. Read the sentence once more, because its subject is not the questionnaire.
German-language textbooks put it the other way around: a test is valid when it really measures the trait it is supposed to measure and not some other one. Both formulations circle the same worry, and yet they hand you different work. Under the American wording you argue about a claim, and the claim can fall apart the moment the same scores are used for something else. Under the German wording you argue about an instrument, which feels tidier and hides exactly that problem.
You validate the interpretation, not the test
Validation in American practice targets the interpretations and uses of test scores, not the instrument that produced them. A motivation scale that supports a defensible claim about differences between two seminar groups does not automatically support a claim about who gets admitted to a program. Nothing about the questionnaire has changed, only the use has. A sentence such as “the questionnaire is validated” therefore says less than it looks like, and a committee that knows the framework will ask what exactly was validated, and for which purpose.
For your own study the consequence is small and very concrete. Name the interpretation you want to defend in one sentence, then show the evidence that supports precisely that interpretation. Whoever writes the methods section this way is protected against the most common follow-up question, because the answer is already on the page.
The five sources of validity evidence
AERA, APA and NCME speak of sources of validity evidence rather than types of validity, and they name five of them. The wording is deliberate: evidence accumulates, and no single source settles the question on its own. Which of the five you can actually draw on depends on your design and your sample, not on how thorough you intend to be.
| Source of evidence | What it asks | Where it comes from in a student project |
|---|---|---|
| Test content | Do the items cover the intended domain? | expert judgment, literature, pretest feedback |
| Internal structure | Do the items behave as the theory predicts? | factor analysis, item and scale statistics |
| Relations to other variables | Do the scores relate to what they should? | correlations with established scales or behavior |
| Response processes | Are people answering the way you assume? | think-aloud pretests, interviews about single items |
| Consequences of testing | What follows from using the scores? | reflection on the decisions the scores would feed |
Not every source is available to a thesis, and nobody expects all five. Two of them, test content and internal structure, are within reach of almost every questionnaire study, and naming the other three as gaps is a stronger move than passing over them in silence.
The older four-part vocabulary you will still meet
Content validity, face validity, construct validity and criterion validity are the labels that most textbooks on the shelf still carry, and your reading list will put them in front of you. The 2014 framework does not treat them as four kinds of validity, it folds the questions behind them into the sources of evidence. Knowing both vocabularies costs one paragraph and saves an awkward moment in the defense.
- Content validity: do the items cover the domain representatively? Answered by reasoning and expert judgment, not by a computation.
- Face validity: does the test look plausible to a layperson? Concerns acceptance among respondents, not the strength of the conclusion.
- Construct validity: is the step from answers to the underlying trait theoretically grounded? Evidence runs in two directions: a high relationship with measures of the same trait is convergent validity, and a deliberately low relationship with measures of something else is discriminant validity. Only the two together carry the argument, and in the 2014 framework both count as evidence based on relations to other variables.
- Criterion validity: can the score predict behavior outside the test situation? Called concurrent validity when the criterion is available now, and predictive validity when it lies in the future.
The most common mistake: content validity and face validity are not the same thing
Content validity and face validity get treated as two names for one thing so often that Moosbrugger and Kelava flag the confusion in their textbook explicitly. The difference lies in who judges, and on what basis. Content validity is a professional judgment about whether the items cover the domain, while face validity is a layperson’s impression that a test looks plausible. A questionnaire can look thoroughly convincing and still measure past the trait, and a clean instrument can look incomprehensible from the outside.
Watch out
Do not write “content validity or face validity” in your thesis. Treating the two as equivalent hands an examiner from the methods side an open flank. Name content validity as the thing you argue for professionally, and face validity at most as an argument about acceptance among the people you survey.
Internal and external validity: a different vocabulary
Internal and external validity judge a study design, not a measuring instrument. Internal validity asks whether a causal conclusion holds inside the study, meaning whether the observed effect really comes from the cause under investigation and not from a third quantity. External validity asks whether the finding carries beyond the situation studied, to other people, other places, other points in time.
Internal and external validity stand in a trade-off, and the trade-off is what makes the pair worth a paragraph in a methods section. A lab experiment with tight control has high internal and often low external validity, because the situation is artificial. A survey in everyday life has it the other way around. A standardized online survey sits in between: the questionnaire reaches people in their familiar surroundings, yet it barely allows cause and effect to be held apart cleanly.
Content, construct and criterion validity do not belong in the same list as internal and external validity. The first group judges an instrument, the second a design. Plenty of summaries file internal and external validity as subtypes of construct validity anyway. Copying that costs exactly the precision a methods section gets graded on.
Create a survey for free
With empirio.ai you can create a modern online survey in minutes — free to start.
- AI-built survey
- Adjust by drag & drop
- Real-time analysis
How objectivity, reliability and validity hang together
Reliability is the precondition for validity, and the dependency runs one way only. Moosbrugger and Kelava put it as follows: objectivity and reliability supply no more than the favorable conditions for high validity, and a test with low reliability cannot have high validity.
The quoted sentence looks unremarkable and carries the whole system. Objectivity comes before both in practice, because a study that leaves wide discretion in the scoring rarely produces stable numbers, but the textbook does not state that as a formal condition, unlike the relationship between reliability and validity. Translated into the American vocabulary the sentence reads: scores that bounce around cannot carry a defensible interpretation, no matter how carefully the interpretation is worded.
A bathroom scale that reads two pounds heavy on every step makes the difference concrete. The scale is objective, because it follows the same rules for every person. The scale is reliable as well, because three measurements in a row give the same number. Valid it is not, since it is wrong in a systematic way. Exactly that case, high reliability with low validity, is the most common one in questionnaires, and the coefficients do not reveal it.
What follows for the order in your methods section
- Clarify first whether the study runs identically for everyone.
- Check next whether your scales are internally consistent.
- Argue last that the items cover the intended trait.
- Report a weak coefficient instead of leaving it out.
A reliable questionnaire measures dependably. Whether it measures the right thing is a separate question.
Do the three quality criteria apply in qualitative research?
Objectivity, reliability and validity were developed for standardized measurement and cannot be carried over to qualitative procedures unchanged. A guided interview is not supposed to produce the same thing on every repetition, precisely because it responds to the individual person.
Qualitative social research has therefore developed criteria of its own. The best known proposal comes from Yvonna Lincoln and Egon Guba in “Naturalistic Inquiry” (Sage, 1985), with the four criteria credibility, transferability, dependability and confirmability. Those four terms grew out of the American methodological debate of the 1980s, and they are the vocabulary a committee in the United States will expect if your data are interviews rather than scores.
For your own project the practical consequence stays manageable. If you collect qualitative data, do not write about Cronbach’s alpha, and instead document selection, procedure and analysis closely enough that someone else can follow the path. Which criteria stand side by side in the two research logics is set out in the article on the quality criteria of quantitative and qualitative research.
Quality criteria in a thesis: where they belong in the outline
Quality criteria have no fixed place in the outline of a thesis. Two arrangements are common and both are defensible: a subsection of its own inside the chapter on the research design, or a passage in the reflection on your own procedure.
Which of the two fits depends on how much your choice of method needs defending for the research question you set. Where the method stands at the center, the criteria belong up front in the design. Where the substantive findings carry the work, they sit more naturally in the reflection. Check it with your advisor in case of doubt, because some departments have a fixed expectation, and your department’s guidelines outrank any general rule.
Option 1: quality criteria as a subsection inside the research design
A subsection inside the research design suits a thesis in which you justify your choice of method at length and the quality criteria are part of that justification. The advantage is that your readers have settled the quality question before they see a single result. The price is that you do not yet know at that point which scales will turn out weak. If your study collects data from people, the review by your Institutional Review Board falls even earlier, and the protocol you submit already describes the instrument.
- Introduction with the research question
- Theory and state of research
- Research design, containing hypotheses, choice of method, population and sample, variables, item pool, and the quality criteria with one subsection each for objectivity, reliability and validity
- Data collection
- Data analysis
- Results
- Reflection on the procedure
- Conclusion
Option 2: quality criteria as a passage in the reflection on your procedure
A passage in the reflection suits a thesis in which the limits of your study can only be named cleanly in the light of the results. The outline stays the same, only the quality criteria move to point 7 and get discussed there together with the limitations of the work. The advantage is honesty, because you write about coefficients you actually obtained rather than about intentions. The price is that the methods critique sits far back and is easily skimmed over. Capstone projects with an outside client often work better this way, since the practical constraints become visible only at the end.
Option 1 and Option 2 are graded by the same yardstick: what counts is not whether a study meets all three criteria, but whether it becomes clear which ones are met and where the limits are.

Common mistakes with the quality criteria
Most of the points lost in a methods section come not from weak coefficients but from statements that claim more than the data allow. Three mistakes turn up especially often.
All three mistakes share a cause: a quality criterion gets used for something it was never built for. Anyone who keeps the three apart avoids the mistakes almost automatically, and the methods section gets shorter rather than longer in the process.
Mistake 1: selling high reliability as proof of validity
A Cronbach’s alpha of 0.89 states that the items of a scale hang together closely. The value says nothing about whether those items capture the trait you mean, and even less about whether the interpretation you want to draw holds up. Writing after the alpha that the scale is therefore valid draws exactly the conclusion test theory rules out. The way around it is one more paragraph on test content, in which you argue why the items cover the domain.
Mistake 2: checking objectivity off because the survey runs online
An online survey largely secures administration objectivity, because every respondent sees the same thing. Scoring objectivity and interpretation objectivity remain untouched by that. As soon as open-ended questions appear in the questionnaire or thresholds get chosen freely, discretion is back in the room. The way around it is to name all three aspects separately instead of ticking objectivity off wholesale.
Mistake 3: keeping quiet about weak values
A reliability coefficient of 0.58 is no reason to drop a scale from the thesis or to leave the value out. What gets graded is the engagement with the number, not the number itself. Naming the value, explaining what it probably comes from and wording the interpretation more cautiously shows exactly the methodological maturity at stake. Values kept quiet, by contrast, surface in the defense at the latest.
Conclusion
Objectivity, reliability and validity are not hurdles to clear but three questions to answer. Absolute fulfillment is the exception even in professional studies, and nobody expects it in a thesis. What is expected is that you can keep the three apart, and that you say openly where your own study runs into its limits.
How to keep going
- Want to build the questionnaire yourself? How to create a questionnaire: steps and structure
- Looking for the right analysis procedure? Data analysis methods in empirical research
- Want the whole process in view? Fundamentals of empirical research
Our reading tip: AERA, APA and NCME (2014): Standards for Educational and Psychological Testing. American Educational Research Association. The volume is the reference for validity, reliability/precision and fairness in the United States and has been freely available since March 2021. The testing standards page at NCME lists the current edition and the download options.
Want your survey to run to the same standard from the first response?
With empirio.ai, an online survey tool from Germany, everyone taking part sees the same questionnaire in the same order, which largely secures administration objectivity. Scoring objectivity and interpretation objectivity stay your job, because both hang on your rules rather than on the tool.