

Two questionnaires want the same information. One asks “How old are you?”, the other asks “What year were you born?”. The answers differ in how complete they are, how precise they are and how well you can analyze them later.
Demographic questions are the items about the person that appear in almost every questionnaire: age, sex, race and ethnicity, education, employment status, income and location. You collect them to compare answers between groups and to judge your sample, and for race and ethnicity there is now a single federal standard to follow rather than a list of your own. By the end you will have six questions you can copy, and a clear idea of which ones to leave out.
📌 The key points
- Demographic questions describe the person, not the topic.
- OMB Directive No. 15 requires one combined race and ethnicity question.
- The 2024 revision added Middle Eastern or North African as a category.
- Demographics at the start do not reduce response rates (Teclaw 2012).
- Groups below five people make anonymity impossible to promise.
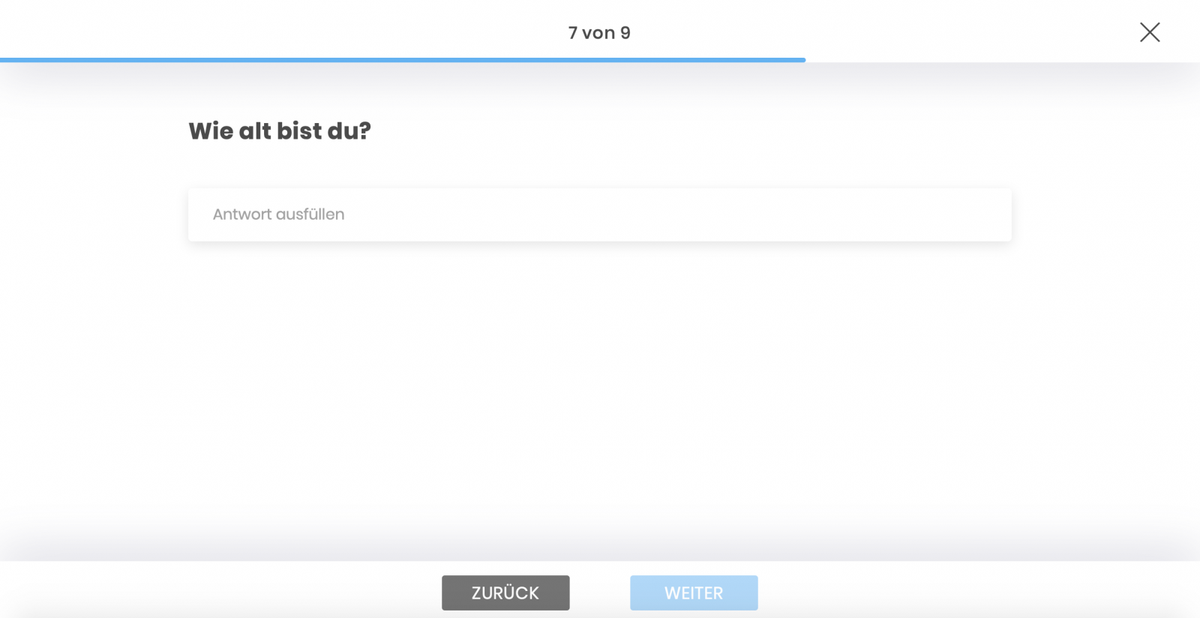
Here is what such a question looks like in a finished questionnaire, as a closed item with fixed categories.
Create a survey for free
With empirio.ai you can create a modern online survey in minutes — with 100% data protection from Germany.
Start for freeWhat are demographic questions?
Demographic questions are items that place a respondent socially and demographically: age, sex, race and ethnicity, education, occupation, employment status, income, marital status and where they live. They describe the person holding the opinion rather than the opinion itself.
That is exactly where their value comes from. Without demographic items you have one average across everyone who took part and nothing else. With them you can ask whether students answer differently from people in work, whether age groups diverge, and whether your sample is composed anything like the population you want to say something about.
Survey methodologists therefore call these background characteristics, and they are the starting point for judging how representative a sample is. For a club survey that sounds excessive. For a thesis it is the difference between an analysis and a column of numbers.
These six items cover most surveys:
- Age, collected as year of birth or as a band.
- Sex or gender, with a prefer-not-to-answer option.
- Race and ethnicity, in one combined question.
- Highest level of education completed.
- Employment status, including students and caregivers.
- Household income, in ranges rather than exact amounts.
Demographic or socio-demographic: where the line sits
Demographic characteristics describe population structure in the narrow sense: age, sex, marital status and location. Socio-demographic characteristics add social position on top: education, occupation, employment status and income. Every demographic item is therefore also socio-demographic, but not the other way round.
In practice the two terms are used almost interchangeably, and no binding standard draws the line. When a template says “demographic questions” it usually includes education and occupation anyway. For your own work the distinction matters far less than the question of which items you will actually analyze.
A third term turns up in market research reports and means something different again: psychographic characteristics, meaning values, interests and lifestyle. Those are not descriptions of the person in the sense used here, they are attitudes, and they belong in the substantive part of your questionnaire.
Socio-demographic describes who someone is. Psychographic describes how someone thinks.
The six demographic questions and how to word them
For race and ethnicity, the United States has a binding federal reference: Statistical Policy Directive No. 15, revised by the Office of Management and Budget on March 28, 2024. For the other items there is no single directive, so the practical reference is whatever the Census Bureau uses in its own instruments.
Comparability is the practical argument for borrowing rather than inventing. If you collect education in categories you made up, you cannot compare your sample against any published figure afterwards, and for a thesis that comparison is often the only evidence you have about sample quality. The wording below is our working version for short online questionnaires.
| Item | How to ask it | What to watch |
|---|---|---|
| Age | year of birth as four digits | bands can be built later, years cannot be recovered |
| Sex or gender | closed list plus prefer not to answer | decide which of the two you actually need |
| Race and ethnicity | one combined question, multiple answers | seven minimum categories since March 2024 |
| Education | highest level completed, one choice | add an option for those still studying |
| Employment | current status, one choice | include students, caregivers and retirees |
| Income | household income in ranges | state before or after tax, and the period |
Asking about age: year of birth or age band?
Year of birth is the better starting form because you can build any grouping from it afterwards. A band never gives you the years back. Anyone who offers “18 to 25” in the questionnaire and then discovers during analysis that the interesting cut is at 21 is simply out of luck.
Privacy pulls the other way in small surveys. A year of birth that appears only once identifies someone in a team of twenty immediately. A useful rule of thumb: once a group contains fewer than five people, a promise of anonymity no longer holds. In that situation, ask in broad ranges from the outset.
Asking about race and ethnicity: one question, seven categories
The revised Statistical Policy Directive No. 15 requires race and ethnicity to be collected in a single question that allows multiple responses, replacing the older practice of asking Hispanic ethnicity separately. The revision also moved Middle Eastern or North African out of the White category and made it a category in its own right, bringing the minimum reporting categories to seven.
Two practical consequences follow for a survey you write yourself. Use one combined question, because a separate Hispanic-origin item now produces data that no longer lines up with federal reporting. And allow multiple selections, otherwise people with more than one background are forced into a single box and your counts stop matching published tables.
Asking about education: keep the ladder recognizable
Education is the item where home-made lists cause the most damage. A ladder that runs from less than high school through high school diploma or equivalent, some college, associate degree, bachelor's degree and graduate or professional degree is recognizable to respondents and comparable to published figures.
Two additions are easy to forget. Include an option for people currently enrolled, otherwise students in their third year have to claim a degree they do not hold yet. And keep vocational and technical credentials visible rather than folding them into “some college”, because that is where a large share of respondents actually sits.
Asking about income: ranges, not exact amounts
The income question cannot be analyzed without three decisions: before or after tax, individual or household, monthly or annual. Leave one out and respondents answer different questions, which makes the average meaningless. A workable wording is: “What was your total household income last year, before taxes?”
Ranges are the right answer format because almost no analysis needs the exact figure. Six to eight ranges are enough, with the top one left open-ended. A prefer-not-to-answer option belongs there too, otherwise you lose people who simply do not want to answer.
Create a survey for free
With empirio.ai you can create a modern online survey in minutes — with 100% data protection from Germany.
Start for freeWhere do demographic questions go in a questionnaire?
Demographic questions sit at the end in most questionnaires, and that is a sensible default. It is not, however, a rule supported by evidence.
The common claim is that demographics at the start put people off. Robert Teclaw, Mark C. Price and Katerine Osatuke tested this experimentally in the Journal of Business and Psychology in 2012: in an online employee survey, one group received the demographic items first and the other received them last. The result was that placing them at the beginning raised the response rate for those items, with no effect on response rates for the remaining questions or on their mean scores.
What follows is not a new blanket rule but a decision based on purpose. Three cases cover almost everything.
- You need to screen or set quotas. Then the items go first, otherwise people outside your target group fill in the whole questionnaire for nothing.
- Your topic is sensitive. Then an easy opening helps, and the personal items go at the end.
- You only need a handful of items. Then position barely matters and you decide by reading flow.
⚠️ Watch out
Push every personal item to the end and you lose all of them whenever someone drops out. The characteristics you would need in order to judge who dropped out are exactly the ones missing. In long questionnaires it pays to move two or three key items to the front and leave the rest at the back.
Sensitive demographic items and who reviews them
Race and ethnicity, religion, health and disability, immigration status, political views and sexual orientation count as sensitive items in almost every privacy framework and in almost every review board's checklist. That does not make them off limits, but it does mean each one needs a stated purpose, an explicit opt-out and a plan for how it will be reported.
Sensitivity is where many lists of demographic questions go wrong, including an earlier version of this article: religion and sexual orientation simply sat between age and marital status. Treating them like a question about zip code is what causes complaints, and in a study run through an institution it is also what causes revisions.
If your survey runs through a college or university, research with human subjects normally goes to an institutional review board before you collect anything. The board decides whether the study is exempt, expedited or needs full review, and your demographic items are part of what it looks at. Deciding which items you actually need before you submit saves a round of revisions.
Then there is the combination trap. Age, sex and department are harmless on their own, but together they usually point at one person in a team of twelve. If you promise anonymity, keep demographic items coarse and drop one rather than adding one. The detail is in the piece on anonymous surveys, and consent language plus a privacy notice template are in the piece on survey data protection.
State privacy laws differ, and so do institutional rules. Where you are unsure, your review board or your institution's research compliance office is what counts. This article is not legal advice.
Common mistakes in demographic questions
The four mistakes below turn up again and again in questionnaires written by students, clubs and small teams. All four only become visible during analysis, by which point it is too late.
What they have in common is that none of them comes from carelessness. They come from writing the question before deciding what the analysis will look like.
A required field with no way out
Forcing an answer to a personal question produces two reactions and both hurt: some people abandon the survey, others click anything. The second group is the more dangerous one, because you cannot tell their answers apart from genuine ones. Every personal item therefore needs a prefer-not-to-answer option, even when the question is set as required.
Survey tools such as Google Forms, SurveyMonkey and empirio.ai all let you make individual questions mandatory. The opt-out does not appear by itself, though: you have to add it as a response option.
Age ranges that overlap or leave gaps
“18 to 25, 25 to 35, 35 to 45” is the classic: anyone who is 25 can click twice. Gaps are just as common, typically when nothing follows “up to 65”. Both come from typing quickly and both take two minutes to fix if you read the boundaries out loud once.
Answer lists that do not fit the audience
An employment status list without “full-time student” is useless for a campus survey. The same goes for education lists with no option for people currently enrolled, and for income ranges that start above what your respondents earn. Check every list against the people who will actually receive the link.
Home-made categories instead of federal ones
Invent your own race, ethnicity or education categories and you cannot compare your sample against any published statistic afterwards. That removes the simplest statement you can make about sample quality, and it is exactly what reviewers ask about. Copying the Directive No. 15 categories takes five minutes and avoids the problem entirely.
Conclusion
Demographic questions are the part of a questionnaire where creativity pays off least. Take the federal categories, collect age as a year of birth, give every personal item a prefer-not-to-answer option, and drop anything you have not planned an analysis for.
Every personal detail you collect is one you then have to protect.
Where to go next
- Building the questionnaire right now? How to create a questionnaire, step by step
- Unsure which question types to use? Question types and answer formats explained
- Wondering what level of measurement age has? Levels of measurement, explained simply
Want to build a questionnaire without retyping the standard items every time?
empirio.ai, an online survey tool from Germany, lets you set required fields and opt-out options question by question.
Frequently asked questions
Create a survey for free
With empirio.ai you can create a modern online survey in minutes — with 100% data protection from Germany.
Start for free