

Two entries from the same dataset: the postcode SW1A 1AA and the age 27. The difference between them is called the nominal scale.
One of them can be averaged and the other cannot, and the postcode makes that obvious because it contains letters. The nominal scale is the lowest level of measurement: it sorts every answer into exactly one category, and between those categories there is neither an order nor a measurable distance. All you may report are frequencies and the most common category, never the mean or the median. By the end of this article you will be able to tell, for every question in your questionnaire, whether it produces nominal data and which analysis still holds.
📌 Key points at a glance
- The nominal scale separates categories without ranking them.
- Gender, degree subject, blood group and postcode are nominal.
- Frequencies, the mode, cross-tabulation and chi-squared are allowed.
- Mean, median and standard deviation make no sense here.
- Numbers on a nominal scale are labels, not quantities.
Create a survey for free
With empirio.ai you can create a modern online survey in minutes — with hosting in the EU.
- AI-built survey
- Adjust by drag & drop
- Real-time analysis
What is a nominal scale?
A nominal scale is a level of measurement on which values can only be told apart and named. There is no ranking and no distance between the categories, which is why only one statement about two answers is possible: they are either the same or different.
The name comes from the Latin nomen, meaning name, and that is exactly what this level does. It hands out names for classes. The maths and stats support team at Sheffield Hallam University puts the practical consequence plainly: chi-squared tests are for categorical data which does not have an order, and that is precisely nominal data (Sheffield Hallam University, Maths and Stats Support).
The four levels of measurement go back to the psychologist S. S. Stevens, who set them out in the journal Science in 1946. On the nominal scale he writes that the numerals serve only as labels and that words or letters would do the same job (Stevens 1946). His rule for assigning them is as short as it gets: no class gets two different numerals and no numeral stands for two different classes.
On a nominal scale a number stands for a name, not for an amount.
Two conditions every nominal question has to meet
Two requirements for the answer categories follow from that rule, and questionnaires break both of them regularly. The categories have to be mutually exclusive, so that every person fits into exactly one box. And they have to be exhaustive, so that every person finds a box at all.
Exclusivity fails fastest with numeric ranges. Offering age bands of “18 to 25” and “25 to 35” lets a 25-year-old fit into two boxes and the count then depends on chance. Exhaustiveness fails with lists written from your own surroundings: a question about your highest qualification offering only GCSEs and a degree leaves out A levels, BTECs, apprenticeships and foundation degrees.
For where the nominal scale sits among the other levels and how to work out the level of a variable, see our article on the level of measurement.
Examples of nominal variables
Nominal variables are those whose values can only be named: gender, degree subject, blood group, region, marital status, nationality, first language or the make of someone’s phone. The table gives the values for each example and the sentence that does not follow from them.
| Variable | Possible values | What does not follow |
|---|---|---|
| Blood group | O, A, B, AB | “AB is more than A” |
| Degree subject | Law, Psychology, Engineering | “the average degree subject” |
| London bus route | 38, 73, 214 | “the 73 is twice the 38” |
The bus route is the most instructive of the three, because it is a number and still counts for nothing. There are no 35 units of anything between the 38 and the 73, and the numbers could just as well be letters. With blood groups this is easier to spot, because letters are used there anyway.
The special case with only two categories
A nominal variable with exactly two values is called dichotomous or binary. Examples are “took part” against “did not take part”, or “member” against “not a member”. Such variables are a borderline case: with only one step between the two values, an order can neither be claimed nor ruled out, and the distinction between nominal and ordinal loses its purpose.
Dichotomous variables are usually coded as 0 and 1, and in that form they can be used even in procedures that normally require a higher level of measurement. The mean is then the proportion of ones and has a clear meaning as a relative frequency. That is a special case of the coding and not a promotion of the nominal scale.
Nominal or ordinal: how to tell the difference
Nominal and ordinal scales differ in exactly one respect, namely the order. An ordinal scale puts the categories into a natural ranking, a nominal scale does not. Everything else they share, above all the division into categories that exclude one another.
The test is a single question: is there a value that is in itself more, higher or better than another? For GCSE grades the answer is yes, a grade 7 is better than a grade 4, so the variable is ordinal. For degree subject the answer is no, because Psychology does not sit above Engineering. The full distinction with all the arithmetic rules is in our article on the ordinal scale.
Qualification is ordinal, degree subject is nominal
Qualification and degree subject look the same at first glance, because both are lists of names. Qualification, however, carries a recognised progression from GCSE through A level to a degree, and that progression is part of the thing itself. Recording qualification as nominal throws this information away, and you can then no longer report a median even though the data would support one.
The order on screen decides nothing
You often read that a question is ordinal because its answer options sit in an order. That only holds if the order comes from the variable itself rather than from the display. Listing the nations and regions of the UK alphabetically does not make them ordinal, and sorting them by population does not either: the ordered variable would then be the population, not the region.
When numbers are only labels
Numbers on a nominal scale are names, not quantities. This includes the student number, the shirt number, the dialling code and the codes 1, 2 and 3 that a statistics package uses to store answer categories. Every one of these numbers could be swapped for another without any loss of information.
Stevens distinguished two uses in 1946, and the distinction is still useful. In the first, every single object gets its own number; his example is the shirt numbers of American football players, which in Britain is worth spelling out because football here means something else entirely. There the only sensible figure is the number of cases. In the second, one number stands for a whole class with several members, and only here can you determine the most frequent class and test for association.
For your questionnaire this produces a simple rule: a student number is an identifier, not a variable. It belongs in the data file so that answers can be matched up, but in no analysis.
⚠️ Careful
Spreadsheets and statistics packages will happily calculate the mean of a nominal variable. No warning appears, the result looks like a number and travels straight into the write-up. Set the level of measurement when you create the variable and record it in your codebook.
Create a survey for free
With empirio.ai you can create a modern online survey in minutes — with hosting in the EU.
- AI-built survey
- Adjust by drag & drop
- Real-time analysis
What you can calculate with nominal data
With nominal data every procedure that only counts is allowed, and every procedure that assumes an order or a distance is ruled out. Stevens set this out in a table in 1946 and gave the nominal scale exactly three entries: the number of cases, the mode and measures of association from a contingency table. The overview below translates that into the calculations you actually meet in an analysis.
| Calculation | Nominal scale | Reason |
|---|---|---|
| Absolute and relative frequency | ✓ | counting assumes no order |
| Mode | ✓ | the most frequently occupied category |
| Cross-tabulation | ✓ | counts two variables at once |
| Chi-squared test | ✓ | compares observed against expected counts |
| Cramér’s V | ✓ | measures the strength of the association |
| Median and quartiles | ✕ | need the categories to be ranked |
| Mean and standard deviation | ✕ | need equal distances |
| Pearson correlation | ✕ | works with deviations from the mean |
The chi-squared test is therefore the standard procedure for nominal variables. Sheffield Hallam University adds a practical warning that matters more than the formula: before running any analysis, check how many observations sit in each group, and either exclude very small groups such as “prefer not to say” or combine them. Thinly populated cells are the most common reason a chi-squared test fails on a student dataset. For two groups you can check significance straight away.
Bar and pie charts suit nominal data
Nominal frequencies belong in a bar chart or a pie chart, because both show shares only and claim no order. A histogram does not fit, because it assumes adjoining, ordered classes. A boxplot does not fit either, because it rests on the median and the quartiles. You choose the order of the bars yourself, and descending by frequency is the usual choice.
In regression, nominal variables become 0/1 variables
Nominal variables can perfectly well be used in a regression, just not in their raw form. The variable is split into dummy variables that take only 0 or 1. Four categories produce three dummies, and the fourth serves as the reference against which the others are compared. Any statistics package does this at the press of a button once the variable is marked as nominal. For the wider picture of analysis stages, see our article on descriptive and inferential statistics.
Nominal scale in a questionnaire: five things to settle first
Whether you end up with nominal data is decided by the wording of the question, not by the analysis. Afterwards a variable can only be made coarser, never finer. Settle the following five points before the survey goes out.
- List the categories in full. Write down every value that can occur in your target group, not only the obvious ones.
- Rule out overlaps. Check every category against every other one, especially with numeric ranges and lists containing umbrella terms.
- Give the residual category a text field. An “other” without an input box collects exactly the answers you will not be able to reconstruct later.
- Separate single choice from multiple choice. Decide deliberately whether exactly one answer should be possible and word the question accordingly.
- Collect fine rather than coarse. Ask for the degree subject in plain text if you can group subjects yourself afterwards.
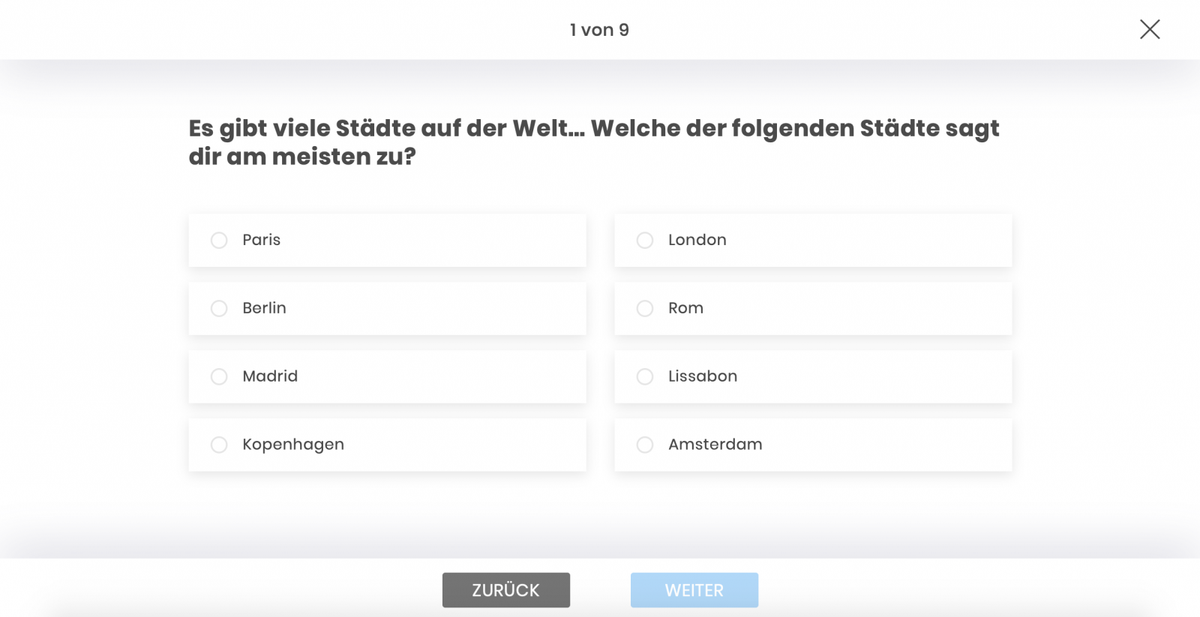
Point three is the one most often underestimated. A residual category that ends up attracting a fifth of all answers makes the whole question useless, because the largest block stays nameless. With empirio.ai, an online survey tool from Germany, you can attach a text field to an answer option and change the list after a pilot run without setting the questionnaire up again.
A multiple choice question gives you several variables, not one
A multiple choice question does not produce a single nominal variable. Every answer option becomes a dichotomous variable of its own, with the values ticked and not ticked. Eight options therefore give you eight variables and the percentages do not add up to 100. Miss this and you will later report shares that total 180 per cent and have to redo the table. For which question type yields which data, see our overview of question types in a questionnaire.
💡 Tip
Have three people from your target group read the list of categories before you send it out, with one question only: can you find yourself in here? Anyone who cannot will later tick “other” or drop out.
Common mistakes with the nominal scale
Most mistakes around the nominal scale happen not in the arithmetic but in the classification. A variable is recorded at the wrong level and everything that follows inherits that decision. Three cases turn up particularly often.
Averaging numeric codes
If single is stored as 1, married as 2 and divorced as 3, every package will dutifully report a mean of 1.9. That number describes nothing, because the codes could just as well have been 7, 3 and 12 and the mean would have been completely different. Report the frequency per category and the mode instead.
Recording an ordered variable as nominal
Qualification, satisfaction and frequency answers such as never, rarely and often carry an order within them. Treating them as plain categories gives away the median and every rank-based procedure. The check takes a moment: if one value can sensibly be described as more or less than another, the variable is at least ordinal.
Letting the residual category grow
“Other” is a fallback, not a category. Once it ranks among the three most common answers, the list was incomplete and the analysis cannot name its largest part. With a text field the block can still be broken down afterwards; without one, nobody reaches that information again.
Conclusion
The nominal scale is the simplest level of measurement and still the one that goes wrong most often in questionnaires. The reason is rarely the statistics, it is the answer categories: get them complete and free of overlap and the hard part is behind you, because counting is quick. Remember the one question that settles it: is one value worth more than another? If the answer is no, you are looking at a nominal scale.
Where to go next
- Want to see how the four levels fit together? Determining the level of measurement
- Need the next level up? Ordinal scale
- Working with distances? Interval scale
- Putting your questionnaire together? Creating a questionnaire
Want to try your answer categories out straight away?
With empirio.ai you can set up a question with fixed categories in a few minutes, send it to three test readers and change the list before the real survey starts.